Part 3 of 3 in our series on context graphs for enterprise AI
By now, the case for context graphs should be clear. They’re the emerging architectural layer that captures the business rules, relationships, definitions, and decision traces that AI needs to move from demo-grade accuracy to production-grade accuracy (read about the foundations in part 1 here). Gartner predicts over 50% of AI agent systems will leverage them by 2028. Foundation Capital called them AI’s trillion-dollar opportunity. And as we covered in Part 2, they fill a gap that neither knowledge graphs nor data catalogs were designed to close.
But here’s the question that matters most: where do you actually start?
Building comprehensive context across an entire enterprise sounds like a multi-year initiative. It doesn’t have to be — if you approach it the right way.
Aggregate, don’t rebuild
This is the key principle. Most of the context your organization needs already exists. It’s just fragmented across systems that don’t talk to each other.
Technical metadata is already in your databases — schema definitions, column types, table structures. These are available via standard APIs and metadata crawlers. Relationships are partially captured in data models, ERDs, and primary/foreign key constraints where they’re enforced. They’re also partially inferable from query logs — if two tables are consistently joined on a particular key by experienced analysts, that’s a strong signal about the valid relationship. Business definitions are partially in your data catalog. Coverage may only be 30–40%, but that’s 30–40% you don’t have to recreate. Semantic logic — metric definitions, fiscal calendars, calculation logic, dimensional hierarchies — is partially in your BI tools, even if it’s locked inside individual tools and potentially inconsistent across them.
The fastest path to production-grade AI accuracy isn’t creating context from scratch. It’s connecting and unifying what you already have, then filling the gaps that matter most. The time comparison is stark: manually building context from scratch takes 6 to 12 months per domain. Aggregating existing context and filling gaps takes 2 to 4 weeks per domain for initial coverage.
Assess where you actually are
Before building anything, take stock. Most enterprises are further along than they think — but the coverage is uneven across context layers.
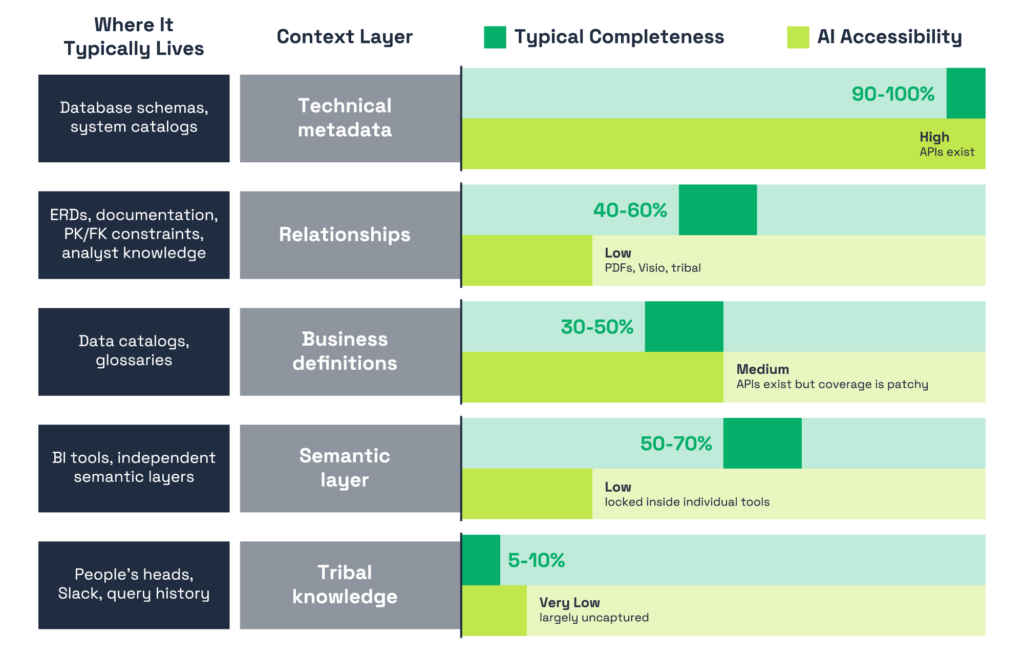
The pattern we are seeing is consistent. The layers closest to raw data — technical metadata, schema structures — are well-covered and accessible. But the layers closest to how decisions actually get made — semantic logic locked inside individual BI tools, relationships documented only in people’s heads, tribal knowledge that’s never been captured at all — are sparse and fragmented in most enterprises. This is exactly why AI accuracy plateaus for most organizations. The context that’s easy to capture gets you partway there, but the context that closes the gap is the hardest to reach.
Pick your first use case wisely
Don’t try to boil the ocean. And don’t start by cataloging every table in your data warehouse. Start with the questions your business actually needs answered.
Pick one domain — Finance, Sales, Marketing — and identify the 5–10 business questions that matter most. “What was our revenue last quarter?” “What’s our current churn rate?” “Which campaigns drove the most pipeline?” These are the questions your team asks repeatedly, the ones that currently require a senior analyst to answer correctly because they depend on context that isn’t documented anywhere.
Then work backwards. For each question, map out what context AI would need to answer it accurately: which systems hold the data, how they connect, what the key terms mean in your organization, which business rules apply, and what the person asking actually expects. This question-centric approach is fundamentally different from a data-centric one — instead of trying to describe everything in your environment, you’re building context around the decisions that matter most.
Consider your audience as you prioritize. Executive queries have different accuracy requirements than exploratory analysis. If your first use case involves a metric that goes into board decks, the bar for correctness is higher — and so is the value of getting it right.
Look for exception-heavy workflows too. Deal desks, underwriting, compliance reviews, escalation management — any workflow where a high headcount is doing manual work because the decision logic is too complex for simple automation. These are signals that rich, uncaptured context exists and that formalizing it would unlock significant value.
Scale through phases, not big bangs
Once you’ve proven value in your first domain, expanding follows a natural progression — not a big bang.
Start with the foundation: aggregate the technical metadata and relationships for your initial domain, connect to your existing catalog and BI tools, and establish a baseline. From there, move into enrichment: integrate semantic layer logic, unify metric definitions across tools, and resolve conflicts between competing definitions. Then shift into learning: begin capturing tribal knowledge through query pattern mining, user feedback, and expert validation. This is where persona context starts to develop — the system learns that when the CFO asks about revenue, they want recognized revenue, not bookings.
Finally, expand to adjacent domains. Each new domain is faster than the last because shared context — fiscal calendars, customer definitions, regional hierarchies — carries over. Cross-domain context, the kind that matters most for executive-level questions that span Finance and Sales or Marketing and Revenue Operations, starts compounding as you grow.
The speed at which you move through these phases depends on whether you’re building manually or leveraging a platform that can aggregate and assemble context automatically. Our Complete Guide to Context Graphs goes deeper on both paths and what to expect from each.
Build for learning, not just documentation
This is perhaps the most important principle: you cannot predefine context for every possible question. The combinatorial space of questions, data sources, definitions, and user intents across an enterprise is effectively infinite.
This means your context graph needs to be built for dynamic learning, not static coverage. Every query is a signal. When a user asks a question, refines it, corrects the result, or accepts it — that interaction generates context. Which tables were useful? Which join path was correct? Which definition did the user intend? A well-designed system captures these signals and incorporates them into its context graph automatically.
When the system encounters a question it doesn’t have full context for, it should be transparent about what it doesn’t know. “I found revenue data in three systems and I’m not sure which definition applies — here’s what each one shows” is far more useful than confidently returning the wrong number.
This compounding effect is what makes context graphs sustainable at scale — the system gets smarter through use, not just through manual curation. As Gartner notes, context graphs enable “continuous agentic learning through simulation” — a feedback loop where every decision trace makes the next decision better.
Mistakes to avoid
A few patterns that consistently derail context graph initiatives:
Treating it as a one-time project. Context is a living system. Schemas change, business rules evolve, teams restructure. If you build it and walk away, it decays. Budget for ongoing maintenance from the start.
Waiting for perfection before enabling AI. Partial context beats no context. Instead of waiting until every definition is documented and every edge case is mapped, ship early — but ship to the right people first. Start with the analysts and domain experts who already have the context in their heads. They’re the ones who can validate answers, flag errors, and train the system through use. Make them more productive while the context graph learns from their interactions. Then, once accuracy has compounded through that feedback loop, expand to the broader organization. The goal is to get into production fast enough that the system can start learning, not to wait until there’s nothing left to learn.
Creating a central team bottleneck. Five people in a governance team cannot document 10,000 tables across 200 data sources. Context building has to be distributed — domain experts contribute, the platform aggregates, and a central team governs standards and resolves conflicts.
Ignoring relationships and tribal knowledge. Organizations tend to invest in business definitions because that’s what data catalogs support. But accuracy plateaus without relationship context and tribal knowledge. These are the layers that close the gap.
Building in silos. Context built domain by domain, without cross-domain connections, breaks down the moment someone asks a question that spans Finance and Sales — which is exactly the kind of question executives ask. Plan for cross-domain from the beginning, even if you start with one domain.
Context is becoming the new moat
The AI model landscape is commoditizing fast. The performance gap between frontier models is shifting and narrowing with every release. If every company has access to the same models, the advantage goes to the organizations that can make those models useful inside their specific business context.
And that’s the thesis behind this entire series: context is the new moat. The tribal knowledge, the undocumented nuances, the decision traces that make data actionable — that’s unique to every enterprise. It can’t be downloaded, copied from a competitor, or built overnight. It can only be built through the accumulated experience of your organization.
The organizations investing in context graphs today aren’t just getting better AI answers. They’re building a compounding asset — one that gets richer with every query, every correction, every new user and agent that touches the system. That flywheel is what separates a demo from a production system, and a pilot from a platform.
This three-part series has covered the what, the why, and the how — but we’ve only scratched the surface. If you want to go deeper on the full anatomy of a context graph, see real-world examples of how context resolves ambiguous business questions, and follow a detailed implementation roadmap, we put together a comprehensive guide that covers all of it: The Complete Guide to Context Graphs for Enterprise AI.
And to see how Gartner frames context graphs as essential infrastructure for agentic systems — including their comparison of knowledge graphs and context graphs, strategic planning assumptions, and recommendations for the next 6–18 months — download a complimentary copy of their research here.