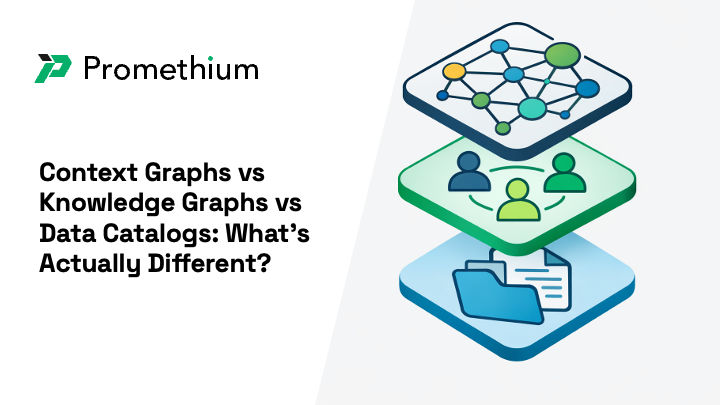
Part 2 of 3 in our series on context graphs for enterprise AI
If you read Part 1 of this series and your first reaction was “this sounds a lot like a knowledge graph” or “isn’t this what our data catalog already does” — you’re not alone. It’s the most common response we hear, and it’s a reasonable one. There’s genuine overlap between these concepts. But the differences matter — and understanding them is key to understanding why context graphs are getting so much attention right now.
The one-line version
A knowledge graph maps what things are. A data catalog maps where things live. A context graph maps how decisions work.
That distinction sounds subtle, but it changes everything about what AI can do with the information.
Knowledge graphs: the entity layer
Knowledge graphs have been around for over a decade. They model semantic relationships between entities — customers, products, locations, transactions — and the connections between them. Google’s Knowledge Graph, launched in 2012, is probably the most famous example. In the enterprise, knowledge graphs are used to create consistent business vocabularies, power search and recommendation systems, and enable reasoning across structured data.
They’re noun-centric. The primary content is entities and relationships: “Customer A purchased Product B in Region C.” They’re typically built from declared or curated schemas and ontologies, and they tend to be relatively static — you define the structure, populate it, and update it periodically.
Knowledge graphs are excellent at what they do. If you need a consistent vocabulary across your organization, or you want to power entity-based search and discovery, a knowledge graph is the right tool. But they weren’t designed to capture how decisions get made — which business rules apply in which situations, what exceptions have been approved, or how the same term means different things depending on who’s asking.
Data catalogs: the inventory layer
Data catalogs emerged to solve a different problem: helping organizations understand what data they have and where it lives. They provide metadata inventory — table names, column descriptions, data owners, freshness indicators, usage statistics, and business glossary terms. Good data catalogs also support data governance: who can access what, which datasets are certified, and how data quality is tracked.
They’re asset-centric. The primary content is tables, columns, datasets, and dashboards. They answer questions like “where does revenue data live?” and “who owns the customer table?” Many organizations have invested heavily in data catalogs, and they provide real value for data discovery and governance.
But coverage is often incomplete. It’s common to find that only 30–40% of columns have business descriptions. Glossary terms are frequently disconnected from actual data assets. And critically, data catalogs don’t capture the operational logic that sits between raw data and a meaningful business answer — the calculation rules, fiscal calendars, dimensional hierarchies, and contextual filters that determine what a metric actually means.
Context graphs: the decision layer
Context graphs sit on top of both. They don’t replace knowledge graphs or data catalogs — they augment them by adding the layers that neither captures.
Where a knowledge graph asks “what is this entity and how does it relate to others?” and a data catalog asks “where does this data live and who owns it?” a context graph asks “how does this organization actually make decisions with this data — and what does AI need to know to make the same decisions accurately?”
This is a fundamentally different orientation. Context graphs are verb-centric: decisions, events, actions. They capture decision traces — the directional workflows that show how business processes actually unfold, not just the entities involved. As Gartner describes it, context graphs track “decision flows and event traces, enabling more informed and effective business decision making by AI agents.” Their primary content isn’t entities or assets — it’s “decision traces, directional workflows” that capture how things actually get done.
A few other key differences:
Temporal state. Knowledge graphs are relatively static. Data catalogs provide snapshots. Context graphs are continuously evolving — they maintain validity windows that track when a piece of context was established, whether it’s been recently confirmed, and whether it may be stale. A pricing exception approved three years ago under a different CFO may not apply today. A context graph knows that.
Query focus. Knowledge graphs answer “what” and “who.” Data catalogs answer “where.” Context graphs answer “how” and “why” — how is revenue calculated for this team, why does this metric exclude certain accounts, how should this question be interpreted given who’s asking.
Update cadence. Knowledge graphs are updated through periodic batch processes. Context graphs are designed for real-time or streaming updates — learning from every query, correction, and interaction. Gartner highlights that context graphs use “implicit, based on tracing and automated data extraction and mapping, self-improving and learning” approaches, compared to the “explicit, prompt-focused, manual” methods used for knowledge graphs.
How they help AI agents. Knowledge graphs provide domain knowledge, retrieval, and reasoning support. Context graphs provide process auditability, grounding and guardrailing, and — critically — continuous agentic learning through simulation. They don’t just inform agents; they help agents get better over time.
Knowledge Graph | Data Catalog | Context Graph | |
Core focus | Semantic relationships between entities | Metadata inventory for data discovery | Operational metadata + decision traces |
Orientation | Noun-centric: customers, products, locations | Asset-centric: tables, columns, datasets | Verb-centric: decisions, events, actions |
Temporal support | Limited | Static snapshots | Native time-travel, validity windows |
Best for | Consistent business vocabulary | Data discovery and governance | Enabling AI systems with full operational context |
They work together, not in competition
This is an important point that often gets lost in the conversation: knowledge graphs aren’t replaced by context graphs. They’re augmented by them. As Gartner’s research makes clear, knowledge graphs and context graphs “work together for supporting AI agents’ knowledge and decision layers.”
Think of it as a stack. Your data catalog tells AI what data exists and where to find it. Your knowledge graph tells AI what entities mean and how they relate. Your context graph tells AI how your organization actually uses that data to make decisions — the rules, the exceptions, the tribal knowledge, and the intent behind every question.
Most organizations already have pieces of this stack in place. The gap isn’t that they’re starting from zero — it’s that the top layers, the ones closest to how decisions actually get made, are fragmented across tools, teams, and people’s heads. Context graphs are the architecture for unifying those fragments into something AI can use.
Why the distinction matters now
You might be wondering whether this is a meaningful architectural distinction or just new packaging for existing concepts. Here’s why it matters: the current generation of AI tools — RAG pipelines, semantic layers, data catalogs — gets you to roughly 50–65% accuracy on enterprise business questions. That’s good enough for exploratory analysis. It’s not good enough for an autonomous agent making decisions on behalf of your business.
The jump from 65% to 95%+ accuracy requires exactly the layers that context graphs add: decision traces, tribal knowledge, persona context, and continuous learning from usage. No amount of better retrieval or smarter prompts can substitute for context that simply isn’t captured anywhere in machine-readable form.
That’s the gap context graphs are designed to close. And as agentic AI moves from pilot to production in 2026 and beyond, it’s the gap that will separate organizations that get real value from AI from those that keep cycling through demos.
In Part 3 of this series, we’ll get practical: how do you actually start building a context graph without turning it into a multi-year project?
To read what Gartner has to say about how context graphs are solving AI’s institutional memory problem — including a detailed comparison of knowledge graphs and context graphs, strategic planning assumptions, and recommendations for the next 6–18 months — click here to download a complimentary copy of the report.
For a comprehensive practitioner guide covering what’s inside a context graph, real-world examples, and a phased implementation roadmap, see our Complete Guide to Context Graphs for Enterprise AI.