Part 1 of 3 in our series on context graphs for enterprise AI
If you’ve been anywhere near the enterprise AI conversation in the past few months, you’ve probably started hearing a new term: context graph.
Foundation Capital called it “AI’s trillion-dollar opportunity” in a December 2025 essay that quickly became one of the most-discussed ideas in AI. Dharmesh Shah (HubSpot) called context graphs “a system of record for decisions, not just data.” Aaron Levie (Box) wrote that “we’ve entered the era of context.” Arvind Jain (Glean) said it “finally has a name.” And in February 2026, Gartner published dedicated research calling context graphs “the new essential infrastructure for agentic systems,” predicting that by 2028, over 50% of AI agent systems will leverage them.
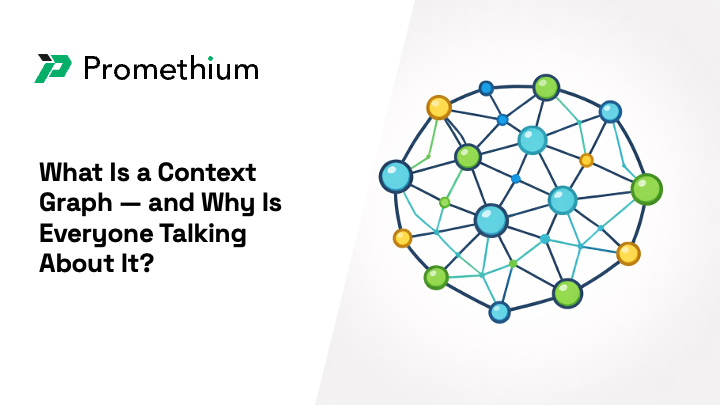
So what exactly is a context graph — and why has it captured this much attention this fast?
The short version
A context graph is a living record of how your organization actually makes decisions — the business rules, data relationships, metric definitions, and institutional knowledge that are spread across systems, tools, and people’s heads — structured so that AI can use it.
Think of it as institutional memory, made machine-readable.
When an analyst asks an AI agent “What was our Q4 revenue?” the answer depends on a dozen things that aren’t in any database: which system holds the authoritative revenue number, whether “Q4” means fiscal or calendar, what counts as “revenue” (bookings? recognized? ARR?), which customer segments to include, and what the person asking actually wants. Today, that knowledge lives in BI tools, data catalogs, spreadsheets, Slack threads, and the heads of people who’ve been at the company long enough to know how things work. A context graph brings all of that together in a structure AI can traverse at query time.
Why now?
Context graphs aren’t a new computer science concept. Graph-based approaches to organizing knowledge have been around for decades. Three forces are converging to make them suddenly urgent.
Agentic data analytics isn’t ready for prime time — yet. Last year, a wave of organizations ran proofs of concept on agentic analytics — AI agents that could answer business questions by querying data directly. The demos were impressive. But when teams tried to move these pilots into production, accuracy fell apart. The agents couldn’t reliably handle ambiguous business terms, conflicting definitions across systems, or the unwritten rules that govern how data should actually be interpreted. The conclusion across the industry has been clear: the models are good enough, but the approach needs to be fundamentally different.
RAG and prompt engineering have hit a ceiling. For the past two years, retrieval-augmented generation has been the default approach to grounding AI in enterprise data. And for many use cases, it works. But as organizations move to production scale, RAG’s limitations are becoming clear. Precision drops as data volume climbs. Context windows overflow. And even when retrieval is accurate, the model may not match the right information to the nuances of the question. Prompt engineering faces a similar ceiling — carefully crafted prompts can’t encode the organizational knowledge, business rules, and decision history that production AI needs.
Context engineering has arrived as a discipline. In June 2025, Andrej Karpathy — former AI director at both OpenAI and Tesla — wrote a post that redefined how the industry thinks about building AI applications: “In every industrial-strength LLM app, context engineering is the delicate art and science of filling the context window with just the right information for the next step.” The framing resonated immediately. Forrester titled a November 2025 report “The Year Context Became King.” MIT Technology Review tracked the shift from “vibe coding” to “context engineering” as the defining evolution of 2025 software development. Context graphs fit within this movement as the data layer for context engineering — the structured, persistent, enterprise-specific context that agents need to answer questions accurately.
What’s actually inside one?
A context graph captures several layers of organizational knowledge. At the foundation, there are relationships — how data sources and entities connect to each other, the join paths and foreign keys that determine which tables can be combined and how. On top of that sits a semantic layer — what business terms actually mean in your organization, how metrics are calculated, which fiscal calendar applies, what inclusion and exclusion criteria govern a given report.
Then there are business rules — the operational logic that determines how data should be filtered, calculated, and interpreted depending on the context. Some rules are universal (the fiscal calendar). Others are domain-specific (the finance team’s revenue recognition method). Others are contextual — they depend on who’s asking.
Lineage and trust signals track where data came from, how it was transformed, and how reliable it is. And at the top sits the layer that makes context graphs genuinely different from anything else: decision traces and tribal knowledge— the exceptions, precedents, persona preferences, and accumulated institutional knowledge that live in people’s heads. The pricing exception your VP approved last quarter. The reason your team always excludes test accounts. The fact that the CFO wants recognized revenue, not bookings, when they ask about “revenue.”
This last layer is what no existing tool captures well. Data catalogs capture metadata. Semantic layers capture business definitions. But neither captures the accumulated institutional knowledge — the “why” behind decisions — that makes AI answers truly accurate.
Why it matters
Without a unified context layer, AI accuracy plateaus. If all AI has access to is technical metadata — table names, column types, schema structures — it’s guessing at everything else. It doesn’t know which tables to join, what “revenue” means in your organization, which fiscal calendar to apply, or what the person asking actually wants. Add relationship context and it gets a bit better. Add business definitions and it improves further. But it’s only when you layer in the full picture — semantic logic, business rules, and the tribal knowledge and persona context that capture who’s asking and what they actually mean — that AI can deliver answers your organization would trust in a board meeting.
Most organizations today are stuck in the middle. The context that’s easy to capture gets them partway there. The context that’s hard to capture — the context that lives in people’s heads, in Slack threads, in undocumented exceptions — is what closes the gap. That’s what context graphs are designed to unify.
As Gartner put it in their recent research on context graphs: “The missing piece is the ‘why’ and the ‘how,’ especially if decision elements happened outside of their system.” Context graphs capture exactly that.
This is just the beginning
Context graphs are an emerging concept, and the tooling, patterns, and best practices are evolving fast. But the signal from analysts, investors, and practitioners is consistent: the enterprises that figure out how to deliver context to AI at scale will be the ones that make the transition from pilot to production. The rest will keep cycling through demos.
In Part 2 of this series, we’ll dig into one of the most common questions people ask when they first hear about context graphs: “How is this different from a knowledge graph or a data catalog?”
Want the full picture? We put together a comprehensive guide covering what context graphs are, how they work, and how to start building one. Download: The Complete Guide to Context Graphs for Enterprise AI