Microsoft Fabric represents one of the most significant shifts in enterprise analytics since SQL Server. But what exactly is it, and why should data teams care?
If your organization struggles with data scattered across multiple platforms, complex ETL pipelines, or fragmented analytics tools, Microsoft Fabric offers a compelling alternative. This guide breaks down what Fabric is, how it works, and what makes it different from traditional approaches.
What is Microsoft Fabric?
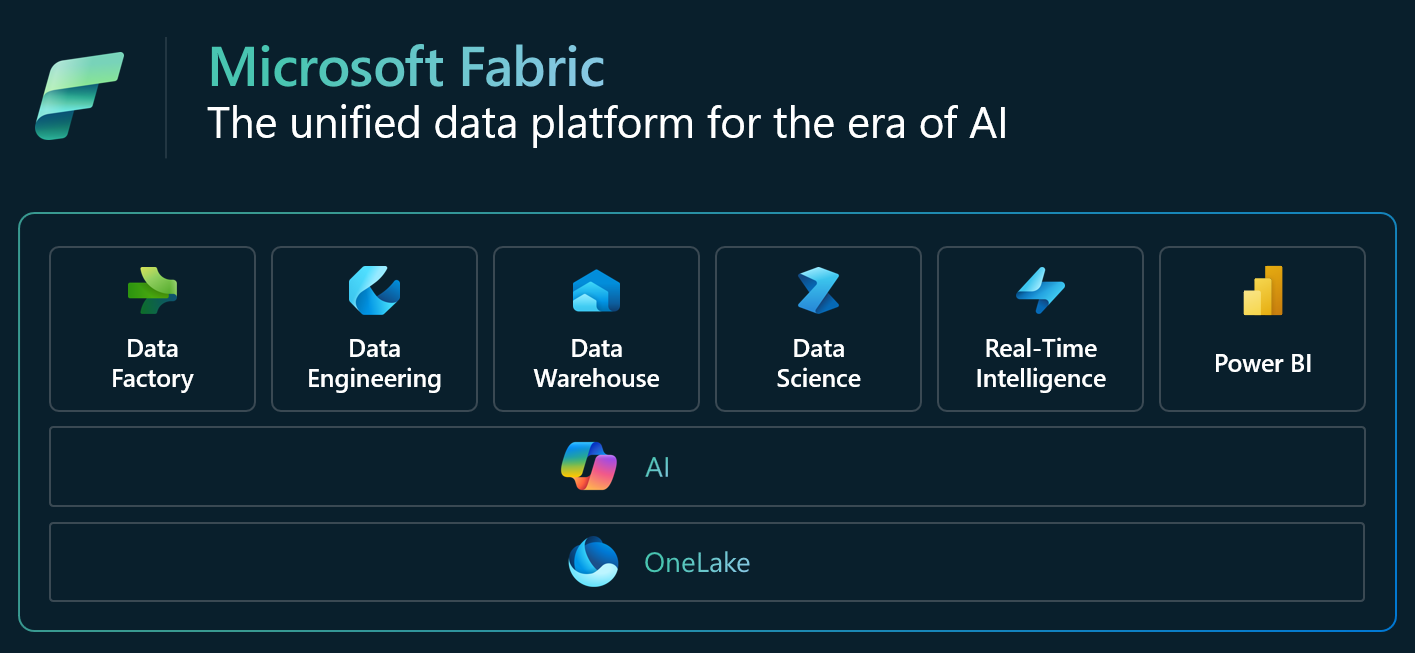
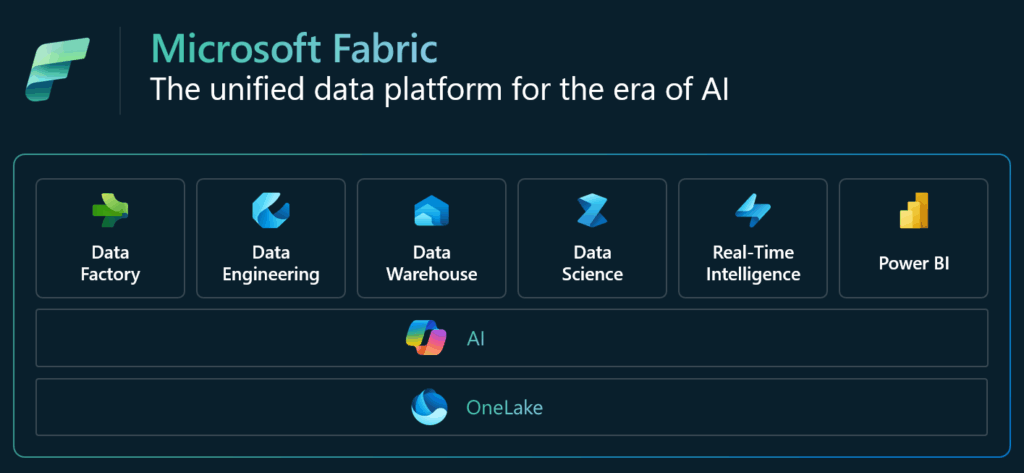
Microsoft Fabric is a unified, end-to-end, cloud-based Software-as-a-Service (SaaS) analytics platform launched in May 2023 and made generally available in November 2023. It brings together data integration, engineering, warehousing, science, real-time analytics, and business intelligence into a single cohesive environment.
The platform unifies previously separate Microsoft data services — Azure Data Factory, Azure Synapse Analytics, Power BI, and others — into one SaaS offering built on a unified data lake foundation called OneLake.
The core promise: Eliminate data silos and provide seamless access to unified analytics capabilities without the complexity of managing multiple platforms, coordinating data movement, or building custom integrations.
Think of it this way: instead of stitching together separate tools for data pipelines (Azure Data Factory), big data processing (Synapse Spark), data warehousing (Synapse SQL), business intelligence (Power BI), and machine learning (Azure ML), you get all these capabilities in one integrated environment. Your data engineers, data scientists, and business analysts work in the same platform, accessing the same data foundation, with unified security and governance.
The Foundation: Understanding OneLake
OneLake sits at the heart of Microsoft Fabric’s architecture. Think of it as a single, organization-wide data lake that every Fabric workload uses automatically — similar to how OneDrive provides unified file storage across Microsoft 365 applications.
Here’s what makes OneLake different:
Single unified storage. One OneLake per organization (tenant), eliminating the need to copy data between services or maintain multiple storage layers. Every workspace in Fabric automatically gets storage in OneLake without separate provisioning.
Delta Lake format. All data gets stored in open Delta Lake format, providing ACID compliance, versioning, time travel capabilities, and interoperability with non-Microsoft tools. This means you can access your Fabric data using Apache Spark, Presto, or other open-source engines.
Zero-copy architecture. Data stays where it is through shortcuts and mirroring. Fabric accesses it through virtualization rather than physically copying it between systems. A shortcut in OneLake creates a virtual pointer to data stored elsewhere — whether in Azure Data Lake Storage, AWS S3, or Google Cloud Storage — making it appear as if it’s in OneLake without actual data movement.
Built-in governance. Automatic compliance boundaries and security enforcement across all data, regardless of which workload accesses it. Permissions set at the OneLake level apply consistently whether you’re querying through SQL, Spark, Power BI, or any other Fabric workload.
Medallion architecture structure. Follows a medallion architecture pattern with three progressive data quality layers:
- Bronze Layer (Raw Zone): Original data in native format, append-only and immutable for compliance
- Silver Layer (Enriched Zone): Cleansed, standardized, and structured data with basic transformations applied
- Gold Layer (Curated Zone): Business-ready data optimized for analytics, aggregated and modeled for specific use cases
This foundation means you can write data once and access it across Data Factory pipelines, Spark notebooks, SQL warehouses, Power BI reports, and machine learning models without duplication. When your data engineer transforms raw customer data into a cleaned dataset, your data scientist and business analyst both see the same version immediately — no waiting for pipelines to copy data between systems.
Core Components: Seven Integrated Workloads
Microsoft Fabric combines seven distinct but integrated workloads, each addressing specific analytics needs while sharing the same underlying data and metadata. Here’s what each workload does and when you’d use it.
1. Data Factory
Your data integration layer connecting to over 300 data sources through pre-built connectors. Data Factory handles both ETL (Extract, Transform, Load) and ELT (Extract, Load, Transform) pipeline orchestration, batch processing, and real-time data movement.
Key capabilities:
- Visual pipeline designer with drag-and-drop activities
- Dataflows Gen2 provides a low-code Power Query interface for citizen data integrators
- Support for complex orchestration with conditional logic, loops, and error handling
- Integration with Git for version control and CI/CD deployment
When to use it: Moving data from external systems into OneLake, orchestrating complex data workflows across multiple sources, scheduling batch data loads, or transforming data during ingestion.
Real-world example: A retail company uses Data Factory to pull daily sales data from 200+ store systems, website clickstream data from Google Analytics, and inventory data from their ERP system — all landing in OneLake’s Bronze layer for downstream processing.
2. Data Engineering (Synapse Data Engineering)
Built on Apache Spark for big data processing at scale. Data Engineering provides notebook-based development environments and implements the lakehouse architecture — combining data lake flexibility with data warehouse structure.
Key capabilities:
- Spark 3.4+ with support for Python (PySpark), Scala, R, and SQL
- Lakehouse architecture with Delta tables for ACID transactions
- Collaborative notebooks with real-time co-authoring
- Managed Spark pools with automatic scaling and optimization
- Integration with MLflow for experiment tracking
When to use it: Processing large volumes of data (terabytes to petabytes), complex transformations requiring custom code, machine learning feature engineering, or building reusable data transformation pipelines.
Real-world example: A healthcare organization processes millions of IoT readings from medical devices daily using Spark to detect anomalies, aggregate metrics, and prepare datasets for predictive maintenance models.
3. Data Warehouse (Synapse Data Warehouse)
Serverless SQL compute that scales automatically based on workload demands. The warehouse uses T-SQL for familiar database operations and includes a Distributed Query Processing (DQP) engine for parallel execution optimized for analytical workloads.
Key capabilities:
- Fully managed with automatic indexing and statistics
- Separation of compute and storage for independent scaling
- Cross-database queries joining data across lakehouses and warehouses
- Support for stored procedures, views, and functions
- Automatic query optimization and performance tuning
When to use it: Structured analytical queries on large datasets, building dimensional data models (star schemas), serving data to BI tools, or scenarios requiring SQL-based transformations and business logic.
Real-world example: A financial services firm builds a dimensional model with customer, product, and transaction fact tables to power executive dashboards showing real-time portfolio performance across global markets.
4. Data Science (Synapse Data Science)
End-to-end machine learning lifecycle management with MLflow integration. The workload connects with Azure Machine Learning services and provides collaborative notebooks for team-based development.
Key capabilities:
- Native MLflow integration for experiment tracking and model registry
- PREDICT function for in-database scoring without data movement
- AutoML capabilities for citizen data scientists
- Built-in support for popular ML frameworks (Scikit-learn, TensorFlow, PyTorch)
- Model deployment to real-time and batch endpoints
When to use it: Building and training machine learning models, experimenting with different algorithms and hyperparameters, deploying models to production, or scoring data at scale.
Real-world example: A telecommunications company builds churn prediction models using customer usage patterns, testing multiple algorithms in parallel and tracking experiments in MLflow before deploying the best model to score millions of customers nightly.
5. Real-Time Intelligence (Synapse Real-Time Analytics)
Handles streaming data and time-series analytics using Kusto Query Language (KQL). Real-Time Intelligence powers live dashboards, complex event processing, and integration with Azure Event Hubs and IoT Hub for operational analytics.
Key capabilities:
- Sub-second query performance on streaming and historical data
- Eventstreams for ingesting real-time data from multiple sources
- KQL database optimized for time-series and log analytics
- Real-time dashboards with automatic refresh
- Anomaly detection and pattern recognition
When to use it: Monitoring IoT sensor data, analyzing application logs and telemetry, detecting fraud in real-time transactions, or building operational dashboards that update continuously.
Real-world example: A manufacturing company monitors production line sensors in real-time, detecting quality issues within seconds and automatically triggering alerts when temperature or pressure readings exceed thresholds.
6. Power BI
Native integration with all Fabric data sources through DirectLake mode — real-time analytics without import delays or performance degradation. Power BI in Fabric represents the most significant evolution of Microsoft’s business intelligence platform in years.
Key capabilities:
- DirectLake for querying OneLake data directly without import or DirectQuery limitations
- Composite models combining imported, DirectQuery, and DirectLake sources
- Copilot in Power BI for natural language report generation
- Paginated reports for pixel-perfect formatting and printing
- Unified semantic models shared across multiple reports
When to use it: Creating interactive dashboards and reports, enabling self-service analytics for business users, building enterprise-wide reporting standards, or delivering insights to executives and operational teams.
Real-world example: A retail chain builds executive dashboards combining sales data from the data warehouse, customer sentiment from real-time social media feeds, and predictive demand forecasts from ML models — all updating automatically as new data arrives.
7. Data Activator
No-code platform for data monitoring and automated responses. Data Activator detects anomalies in real-time and triggers actions in business applications.
Key capabilities:
- Visual rule builder for defining trigger conditions
- Integration with Microsoft Teams, Power Automate, and custom webhooks
- Pattern detection and threshold monitoring
- Historical baseline comparison for anomaly detection
- Scheduling and business hours controls
When to use it: Automating alerts when metrics exceed thresholds, triggering workflows when data conditions are met, notifying teams of anomalies, or integrating data insights into business processes.
Real-world example: A logistics company monitors shipment delays in real-time, automatically notifying customer service teams when deliveries risk missing SLA commitments and triggering proactive communication workflows.
What Makes Fabric Different from Traditional Approaches
Microsoft Fabric’s unified approach represents a fundamental shift from the traditional “best-of-breed” strategy where organizations assemble separate tools and integrate them manually.
Unified Experience Across All Workloads
Every workload shares the same interface, metadata, and security model. One login gives you access to everything. Data lineage flows automatically across tools. No context switching, no separate authentications, no manual metadata synchronization.
What this means in practice: Your data engineer creates a lakehouse table in Spark. Immediately, without any configuration, your data warehouse can query it via SQL, your data scientist can access it in notebooks, your business analyst can visualize it in Power BI, and Data Activator can monitor it for anomalies. The same security permissions apply everywhere automatically.
Traditional approaches require you to manually configure connections, synchronize metadata catalogs, map lineage relationships, and maintain security across separate systems. Fabric eliminates this overhead entirely.
AI and Copilot Integration Throughout
Microsoft Copilot embeds throughout Fabric, generating queries in natural language, creating reports from descriptions, and automating code for data transformations. Azure OpenAI Service integration brings advanced AI capabilities directly into your analytics workflows.
Copilot capabilities across Fabric:
- Data Factory: Generate data pipelines from natural language descriptions
- Data Engineering: Write Spark code from plain English instructions
- Data Warehouse: Convert questions into T-SQL queries
- Data Science: Generate Python code for data analysis and visualization
- Power BI: Create entire report pages from high-level prompts
- Data Activator: Build monitoring rules through conversational interface
Real example: Instead of writing complex SQL joins across five tables, you type “show me total revenue by product category for customers who purchased in the last 90 days” and Copilot generates the optimized query with proper joins, filters, and aggregations.
Zero-ETL Philosophy
Shortcuts virtualize data without movement. Mirroring replicates data in real-time from external sources. The OneCopy principle ensures a single source of truth.
Three ways Fabric handles external data:
- Shortcuts: Virtual pointers to data in Azure Data Lake Storage, AWS S3, Google Cloud Storage, or other OneLake locations. Query the data as if it’s in OneLake without physically copying it. Shortcuts update in real-time as source data changes but do not carry over all metadata.
- Mirroring: Real-time replication from operational databases (Azure SQL DB, Azure Cosmos DB, Snowflake) into OneLake with automatic schema synchronization and change data capture. Near-zero latency between source updates and availability in Fabric.
- Direct ingestion: When you need data physically in OneLake, connectors move it efficiently with incremental loads and optimization.
The business impact: A global manufacturer maintains operational data in SAP (on-premises), customer data in Salesforce (SaaS), and IoT data in AWS S3. Fabric shortcuts and mirrors make all this data queryable together without moving terabytes across networks or building custom integration code.
Built-in Governance and Security
Unlike traditional approaches where you implement governance after assembling tools, Fabric builds it into the foundation. Permissions, policies, and audit trails apply consistently across all workloads automatically.
Governance capabilities:
- Information Protection labels from Microsoft Purview apply to all Fabric items
- Row-level security defined once applies across Power BI, SQL, and Spark queries
- Complete lineage tracking from source systems through transformations to reports
- Audit logs capture all data access with user identity and query details
- Data Loss Prevention policies prevent sensitive data from leaving controlled environments
Why this matters: When a new compliance regulation requires masking social security numbers, you implement it once at the OneLake level. Immediately, every query from every workload — SQL, Spark, Power BI, or API — enforces the masking automatically. No hunting through separate systems to update policies.
Security, Governance, and Compliance in Detail
Microsoft Fabric treats security and governance as first-class features rather than add-ons. The platform builds comprehensive protection into every layer of the architecture.
Enterprise Security Architecture
Encryption everywhere:
- Data encrypted at rest using AES-256 in OneLake
- All data in transit encrypted using TLS 1.2+
- Customer-managed keys supported for additional control via Azure Key Vault
- Transparent Data Encryption (TDE) for SQL warehouse tables
Identity and access management:
- Native integration with Microsoft Entra ID (formerly Azure Active Directory)
- Support for single sign-on (SSO) and multi-factor authentication (MFA)
- Conditional access policies for context-aware access control
- Service principal support for application authentication
Network security:
- Private Link support for secure connections without internet exposure
- Virtual network integration for hybrid scenarios
- Firewall rules limiting access by IP address or range
- Managed virtual network for Fabric workloads
Role-based access control:
- Workspace roles (Admin, Member, Contributor, Viewer) for team collaboration
- Item-level permissions for granular access control
- Row-level security for data-level restrictions
- Column-level security for protecting sensitive fields
Compliance and Regulatory Support
Fabric maintains comprehensive compliance certifications making it suitable for regulated industries:
- SOC 2 Type II — Third-party audit of security controls
- ISO 27001 — Information security management certification
- HIPAA/HITECH — Healthcare data protection compliance
- GDPR — European data privacy regulation support
- FedRAMP — U.S. government cloud security requirements
- Industry-specific: PCI-DSS (payment cards), FINRA (financial services), and more
Data residency and sovereignty:
- Multi-geo capabilities allow data storage in specific regions
- Tenant-level controls for data location requirements
- Support for data residency requirements in EU, UK, Canada, Australia, and other regions
- Regional Fabric capacities ensure compute stays near data
Microsoft Purview Integration
Deep integration with Microsoft Purview provides comprehensive data governance:
Automated data discovery:
- Automatic scanning and cataloging of Fabric data assets
- AI-powered classification of sensitive data (PII, financial, healthcare)
- Business glossary integration for consistent terminology
- Data lineage visualization across the entire data estate
Policy enforcement:
- Information Protection labels applied to datasets, reports, and dashboards
- Automatic data classification based on content and context
- Data Loss Prevention (DLP) policies preventing unauthorized sharing
- Access policies enforced at query execution time
Compliance monitoring:
- Complete audit trail of all data access and modifications
- Reports showing who accessed what data and when
- Alerts for policy violations or unusual access patterns
- Integration with Security Information and Event Management (SIEM) systems
Real-world compliance scenario: A healthcare provider uses Fabric to analyze patient outcomes. Purview automatically classifies fields containing Protected Health Information (PHI), applies appropriate sensitivity labels, enforces access restrictions based on user roles, and maintains audit logs proving HIPAA compliance for regulatory audits.
How Fabric Pricing Works
Microsoft Fabric uses capacity-based pricing measured in Fabric Capacity Units (CUs) — a significant departure from traditional per-service or per-user models. Understanding this pricing structure is crucial for budgeting and cost optimization.
>> Click here to learn more about Fabric pricing
Capacity-Based Model Explained
Instead of paying separately for data warehouse compute, Spark clusters, data movement, and BI licenses, you purchase capacity that all workloads share from a common pool. Think of it like buying electricity capacity for your house rather than paying separately for each appliance.
Fabric Capacity Units (CUs) represent compute power. Different operations consume CUs at different rates:
- Complex Spark jobs consume more CUs than simple SQL queries
- Large dataset imports use more than incremental updates
- Interactive Power BI reports consume CUs while users interact with them
F-SKU Options:
| SKU | Capacity Units | Pay-As-You-Go Monthly | Reserved 1-Year Monthly | Typical Use Case |
|---|---|---|---|---|
| F2 | 2 | ~$263 | ~$156 | Development/testing |
| F4 | 4 | ~$525 | ~$313 | Small teams, light workloads |
| F8 | 8 | ~$1,050 | ~$625 | Departmental analytics |
| F16 | 16 | ~$2,101 | ~$1,250 | Mid-size deployments |
| F64 | 64 | ~$8,410 | ~$5,003 | Enterprise standard (includes Copilot) |
| F128 | 128 | ~$16,819 | ~$10,006 | Large enterprise, heavy workloads |
| F256 | 256 | ~$33,638 | ~$20,011 | Global enterprise, mission-critical |
| F512 | 512 | ~$67,277 | ~$40,023 | Very large scale deployments |
(Prices shown for US regions; vary by geography)
Key Benefits of Capacity Pricing
Smoothing and averaging: Pay for average utilization rather than peak capacity. If your analytics workloads spike during month-end close but run light otherwise, capacity-based pricing can significantly reduce costs compared to paying for peak capability all month.
Workload flexibility: CUs work across all Fabric workloads. Morning Spark jobs use capacity that afternoon reports consume. No separate purchases for each service.
Autoscaling: Fabric automatically scales capacity up when demand increases and down when it decreases, preventing throttling while optimizing costs.
Pause and resume: Turn capacity off during nights and weekends for non-production environments, paying only for hours used.
Simplified licensing for Power BI: F64 and higher capacities eliminate the need for individual Power BI Pro licenses ($10/user/month). All users can access reports and dashboards included in the capacity.
Reserved instance savings: Committing to 1-year reserved capacity provides approximately 40% savings over pay-as-you-go pricing.
Additional Costs to Consider
Storage: OneLake storage billed separately at approximately $0.023/GB per month for standard tier. Includes built-in redundancy and backup.
Networking: Data egress charges apply when moving large volumes of data out of Azure regions (ingress is free).
Additional services: Integration with Azure services outside Fabric (Azure OpenAI, Azure ML) billed separately based on usage.
Cost Optimization Strategies
- Right-size capacity: Start with appropriate SKU based on expected workload (F64 recommended for production with Copilot access)
- Use reserved instances: Commit to 1-year terms for predictable workloads
- Implement pause/resume: Automatically shut down non-production capacities during off-hours
- Monitor utilization: Use Fabric Capacity Metrics app to identify optimization opportunities
- Optimize workloads: Use efficient query patterns, partition strategies, and caching to reduce CU consumption
Cost comparison example: A mid-size company previously paid:
- $15,000/month for Synapse Analytics dedicated SQL pool
- $8,000/month for Azure Data Factory pipeline runs
- $12,000/month for Power BI Premium capacity
- Total: $35,000/month
With Fabric F256 capacity:
- $20,000/month reserved instance (all workloads included)
- Savings: $15,000/month (43% reduction)
Common Use Cases and Industry Applications
Organizations adopt Microsoft Fabric to solve recurring challenges across various industries. Here are the most common scenarios driving adoption:
1. Unified Analytics Platform Consolidation
The challenge: Organizations struggle managing separate tools for data integration (Informatica), data warehousing (Teradata), business intelligence (Tableau), and data science (Databricks). Each tool requires specialized skills, separate licensing, and complex integration.
How Fabric solves it: Replace multiple point solutions with a single integrated environment. Data engineers, analysts, and scientists work in one platform, accessing the same data foundation with unified security and governance.
Industry example: A Fortune 500 pharmaceutical company consolidated 7 separate analytics tools onto Fabric, reducing their analytics infrastructure costs by 40% while accelerating time-to-insight from weeks to days. Their data scientists now access clinical trial data the same day it’s collected rather than waiting for weekly ETL processes.
2. AI and Machine Learning Data Preparation
The challenge: Data scientists spend 80% of their time on data preparation — finding data, understanding it, cleaning it, and transforming it for model training. Data scattered across systems makes feature engineering time-consuming and error-prone.
How Fabric solves it: OneLake provides unified access to all data sources. Data Engineering creates reusable feature pipelines. Data Science workload handles the complete ML lifecycle from experimentation to production deployment. MLflow integration tracks experiments and model versions.
Industry example: A large bank reduced model development time from 6 months to 6 weeks by using Fabric to centralize customer data from 12 systems. Their fraud detection model now retrains daily using fresh transaction data, improving detection accuracy by 25%.
3. Real-Time Operational Intelligence
The challenge: Business requires instant visibility into operations, but traditional batch processing creates hours or days of latency. Separate systems for operational data and analytics make real-time insights difficult.
How Fabric solves it: Real-Time Intelligence workload ingests streaming data with sub-second latency. Event processing triggers automated responses. Live dashboards update continuously. Integration with operational systems enables closed-loop analytics.
Industry example: A global logistics company uses Fabric to monitor 50,000+ shipments in real-time, detecting potential delays and automatically rerouting packages. The system processes 2 million location updates per minute, reducing late deliveries by 30%.
4. Self-Service Analytics and Data Democratization
The challenge: Business users depend on IT and data teams for every report and analysis, creating bottlenecks. Weeks-long wait times for ad-hoc analyses slow decision-making. Technical barriers prevent business users from exploring data independently.
How Fabric solves it: Power BI with DirectLake enables business users to create reports without IT intervention. Dataflows Gen2 provides low-code data preparation. Copilot generates queries and reports from natural language. Governance ensures self-service doesn’t compromise security.
Industry example: A retail chain empowered 500+ store managers to analyze their own performance data using Power BI connected to Fabric. IT ticket volume for custom reports decreased 70% while managers gained real-time visibility into sales, inventory, and staffing metrics.
5. Regulatory Compliance and Audit Readiness
The challenge: Demonstrating compliance requires proving data lineage, access controls, and proper handling of sensitive information. Manual documentation is error-prone and doesn’t scale. Audits disrupt operations.
How Fabric solves it: Automatic lineage tracking from source to report. Purview integration classifies sensitive data automatically. Complete audit logs capture every access. Information Protection labels enforce handling policies. Audit reports generate automatically.
Industry example: A healthcare system preparing for HIPAA audit used Fabric’s built-in lineage and audit capabilities to demonstrate compliance across 200+ data sources and 5,000 reports. What previously required 3 months of manual documentation took 2 days using Fabric’s automated reporting.
6. Merger and Acquisition Data Integration
The challenge: Post-acquisition integration requires accessing data from acquired company systems without disrupting operations. Traditional data migration takes 18+ months and risks business continuity.
How Fabric solves it: Shortcuts create virtual access to acquired company data without physical migration. Unified reporting provides combined view of both companies immediately. Gradual migration happens in background while business continues.
Industry example: After acquiring a competitor, a manufacturing company used Fabric shortcuts to create unified executive dashboards within 2 weeks showing combined company performance. Full data consolidation happened over 12 months without disrupting operations.
Industry-Specific Adoption Patterns
Financial Services
Primary use cases: Risk management, regulatory reporting, fraud detection, customer 360 analytics, algorithmic trading analysis
Why Fabric fits: Stringent compliance requirements met through built-in governance, real-time fraud detection capabilities, secure handling of sensitive financial data, complete audit trails for regulatory reviews
Example implementation: Investment banks use Fabric to analyze market data, portfolio positions, and risk exposure in real-time, generating regulatory reports automatically while detecting potential compliance violations before they occur.
Healthcare and Life Sciences
Primary use cases: Patient outcomes analysis, clinical trial management, operational efficiency, population health management, genomics research
Why Fabric fits: HIPAA compliance with built-in PHI protection, integration with healthcare data standards (FHIR, HL7), real-time patient monitoring, research data collaboration across institutions
Example implementation: Healthcare systems analyze patient data across hospitals, clinics, and labs to identify care gaps, predict readmission risks, and optimize resource allocation while maintaining strict patient privacy protections.
Manufacturing and Industrial
Primary use cases: Predictive maintenance, supply chain optimization, quality control, production efficiency, IoT sensor analytics
Why Fabric fits: Real-time IoT data ingestion at scale, integration with operational technology (OT) systems, edge-to-cloud analytics, digital twin implementations
Example implementation: Manufacturers monitor thousands of production line sensors in real-time, predicting equipment failures days in advance and automatically scheduling maintenance during planned downtime to minimize production impact.
Retail and Consumer Goods
Primary use cases: Customer analytics, inventory optimization, demand forecasting, personalization, omnichannel analytics
Why Fabric fits: Integration of diverse data sources (POS, e-commerce, mobile, social), real-time inventory visibility, customer 360 views, AI-powered demand prediction
Example implementation: Retailers analyze customer behavior across online and physical stores, personalizing promotions based on purchase history, browsing patterns, and real-time inventory availability to maximize conversion while minimizing markdowns.
Government and Public Sector
Primary use cases: Citizen services optimization, fraud detection in benefits programs, infrastructure monitoring, public health surveillance, transparency reporting
Why Fabric fits: Government cloud compliance (FedRAMP), data sovereignty controls, public transparency capabilities, cost efficiency for taxpayer-funded systems
Example implementation: Government agencies analyze program effectiveness across departments, detecting benefit fraud patterns while maintaining citizen privacy and generating public transparency reports automatically.
What to Consider Before Adopting Fabric
Microsoft Fabric represents a significant architectural decision with long-term implications. Here’s what to evaluate before committing:
Technical Prerequisites and Planning
Capacity planning requirements:
- Assess current and projected data volumes across all systems
- Analyze query patterns and concurrent user demands
- Estimate workload mix (what percentage Spark vs. SQL vs. Power BI)
- Plan for growth — both data volume and user adoption
Recommended starting point: F64 or higher for production deployments. Lower SKUs work for development/testing but lack Copilot capabilities and may experience performance limitations with production workloads.
Data architecture design considerations:
Align with medallion architecture principles before migration:
- Bronze layer strategy: Which raw sources land where? How long to retain?
- Silver layer transformations: What cleansing and standardization rules apply across the organization?
- Gold layer design: Which business-ready datasets serve which use cases?
Define domain boundaries using Fabric domains for logical data organization. Plan workspace structure aligning with team boundaries and data ownership.
Security and governance framework:
Establish policies before widespread adoption:
- Data classification schema (public, internal, confidential, restricted)
- Access control model (workspace roles, row-level security, column-level security)
- Retention and lifecycle policies for different data types
- Compliance requirements mapping to Fabric capabilities
Integration planning:
Inventory systems requiring integration:
- Which data sources connect via shortcuts vs. ingestion?
- What external applications consume data from Fabric?
- Which existing reports and dashboards migrate to Power BI?
- What custom applications need API access?
Migration Strategy and Approach
Gradual migration beats big bang: Run systems in parallel during transition. Validate accuracy and performance before decommissioning legacy systems. However, migration still comes at a cost.
Recommended migration phases:
Phase 1 — Foundation (Weeks 1-4):
- Provision Fabric capacity in appropriate Azure region
- Configure networking, security, and identity integration
- Set up initial workspaces aligned with domains
- Connect to 2-3 critical data sources via shortcuts
- Build proof-of-concept dashboards demonstrating value
Phase 2 — Core Migration (Months 2-4):
- Migrate high-priority data pipelines to Data Factory
- Replicate critical data warehouses using shortcuts or ingestion
- Convert key Power BI reports to Fabric workspace
- Train initial power users and early adopters
- Establish governance policies and monitoring
Phase 3 — Scaling (Months 4-8):
- Migrate remaining data sources and pipelines
- Implement advanced scenarios (real-time analytics, ML models)
- Expand user access across organization
- Optimize performance and cost based on usage patterns
- Decommission legacy systems no longer needed
Phase 4 — Optimization (Months 8-12):
- Fine-tune capacity sizing and autoscaling
- Implement advanced governance and compliance automation
- Build organizational best practices and standards
- Establish center of excellence for ongoing support
Proof-of-concept success criteria:
Define measurable outcomes for initial POC:
- Connect to X critical data sources within 2 weeks
- Achieve query response time under Y seconds for key reports
- Enable Z business users to self-serve common analyses
- Demonstrate cost savings vs. current approach
- Prove compliance with specific regulatory requirements
Organizational Change Management
User training and adoption:
Different personas need different training paths:
- Data engineers: Spark, Data Factory, lakehouse architecture
- Data analysts: Power BI, DirectLake, Copilot usage
- Business users: Self-service analytics, data discovery
- Administrators: Capacity management, governance, monitoring
Microsoft provides extensive resources:
- Microsoft Fabric Learning Path with free courses
- Fabric Community for peer support
- Fabric Documentation covering all workloads
- Partner training and certification programs
Cultural shifts required:
Adopting Fabric successfully means changing how organizations think about data:
- From siloed ownership to unified collaboration
- From batch to real-time thinking
- From IT-controlled to self-service (with governance)
- From data as byproduct to data as strategic asset
Common adoption challenges:
Organizations frequently encounter these obstacles:
- Resistance from teams invested in existing tools and skills
- Underestimating complexity of data quality and governance
- Insufficient capacity planning leading to performance issues
- Lack of executive sponsorship for organizational change
- Inadequate training and support during transition
Success factors:
Successful Fabric implementations share common characteristics:
- Strong executive sponsorship and clear strategic vision
- Dedicated center of excellence team guiding adoption
- Phased approach with early wins demonstrating value
- Comprehensive training program for all user personas
- Active governance and monitoring from day one
Total Cost of Ownership Considerations
Beyond Fabric capacity costs, factor in these additional investments:
Implementation costs:
- Partner consulting fees for architecture design and migration
- Internal team time dedicated to migration project
- Training and certification for staff
- Parallel system costs during transition period
Ongoing operational costs:
- Fabric capacity fees (see pricing section)
- OneLake storage costs
- Network egress for data movement out of Azure
- Integration with external Azure services (OpenAI, ML)
- Support and maintenance resources
Cost savings to quantify:
Organizations typically achieve savings in these areas:
- Reduced licensing costs from tool consolidation
- Lower infrastructure costs from managed SaaS model
- Decreased data engineering overhead from zero-copy architecture
- Reduced IT support burden from self-service capabilities
- Faster time-to-insight improving business outcomes
Build a complete business case:
Compare total 3-year cost of ownership:
- Current state: All existing tool licenses, infrastructure, personnel
- Future state: Fabric capacity, storage, implementation, training
- Quantified benefits: Productivity gains, faster insights, cost avoidance
Most organizations target 18-24 month payback period for Fabric investments.
How Fabric Compares to Major Alternatives
Understanding where Fabric fits in the competitive landscape helps frame its strengths and limitations against other enterprise analytics platforms.
>> Click here to access a more detailed assessment of alternatives
Microsoft Fabric vs. Databricks
Databricks strengths:
- More advanced data science and ML capabilities
- Stronger Apache Spark optimization and performance
- Better support for Python-first data workflows
- More mature Delta Lake implementation
- Superior open-source ecosystem integration
Fabric advantages:
- Deeper Microsoft ecosystem integration (365, Teams, Azure)
- Better accessibility for non-technical business users
- Unified BI and analytics in single platform (Databricks requires separate BI tool)
- More comprehensive governance out of the box
- Lower total cost for organizations primarily using Microsoft stack
When to choose Databricks: Advanced data science teams, Python-centric workflows, need for cutting-edge ML capabilities, multi-cloud portability requirements
When to choose Fabric: Microsoft-centric organizations, need for unified BI and analytics, business user self-service priority, lower technical complexity preference
Microsoft Fabric vs. Snowflake
Snowflake strengths:
- More mature data sharing marketplace (Snowflake Marketplace)
- Better multi-cloud portability (runs natively on AWS, Azure, GCP)
- Stronger separation of compute and storage economics
- More granular cost control and optimization
- Superior support for semi-structured data (JSON, Avro, Parquet)
Fabric advantages:
- Complete analytics lifecycle beyond just data warehousing
- Native real-time streaming and analytics capabilities
- Deeper Power BI integration and DirectLake performance
- Unified workspace for all data roles (not just analysts)
- Lower barrier to entry for small teams
When to choose Snowflake: Multi-cloud strategy, data marketplace needs, primarily SQL-based analytics, desire for more cost control granularity
When to choose Fabric: End-to-end analytics requirements, Microsoft ecosystem preference, real-time analytics needs, unified platform for multiple personas
Microsoft Fabric vs. Promethium Open Data Fabric
While the platforms above represent alternative unified analytics approaches, Promethium takes a fundamentally different architectural approach that complements these platforms:
Promethium’s distinct approach:
- Zero-copy federation vs OneLake data centralization requirement
- Query data in place across existing systems without migration
- Open architecture vs Microsoft ecosystem dependency
- Instant deployment (weeks) vs platform implementation (months)
- Natural language interface through Mantra™ AI agent vs technical workload complexity
When Promethium makes sense:
- Data already well-organized across Snowflake, Databricks, and other platforms
- Multi-cloud strategy requiring true vendor independence
- Need to avoid data migration costs and timelines
- Want to preserve existing technology investments
- Require business-user accessibility without extensive training
When Fabric makes sense:
- Building analytics capabilities from scratch in Microsoft ecosystem
- Deep Azure and Power BI investments already in place
- Unified platform simplicity outweighs flexibility concerns
- Committed to Microsoft roadmap and support model
Architectural difference:
The key distinction comes down to data architecture philosophy:
- Fabric (and competitors): Centralize data in unified platform for optimal performance
- Promethium: Federate queries across distributed data without movement
Both approaches solve the unified analytics challenge but with different tradeoffs around migration effort, vendor independence, and deployment speed. Learn more about open data fabric approaches or compare architectural approaches.
Microsoft Fabric vs. Amazon Redshift / AWS Analytics
AWS strengths:
- Deeper AWS service integration (Lambda, SageMaker, etc.)
- More mature service ecosystem with specialized tools
- Better support for AWS-native data sources (S3, DynamoDB)
- More granular service selection and cost optimization
- Stronger open-source tool support (Presto, Trino, Hudi)
Fabric advantages:
- Unified SaaS experience vs. assembling multiple services
- Simpler pricing and capacity management
- Better business user accessibility
- Integrated BI capabilities without separate tools
- Less infrastructure management overhead
When to choose AWS: AWS-centric infrastructure, need for specialized services, preference for best-of-breed assembly, existing AWS expertise
When to choose Fabric: Microsoft ecosystem, simplified operations preference, unified analytics platform need, faster time to value priority
Microsoft Fabric vs. Google BigQuery / GCP Analytics
GCP strengths:
- Superior real-time streaming performance (Dataflow)
- Better built-in machine learning (BigQuery ML)
- More advanced geospatial analytics capabilities
- Simpler serverless SQL pricing model
- Stronger integration with Google Workspace
Fabric advantages:
- More comprehensive data integration capabilities
- Better enterprise governance and security features
- Unified platform for complete analytics lifecycle
- Deeper business intelligence functionality
- Better support for on-premises and hybrid scenarios
When to choose GCP: Google Cloud infrastructure, advanced ML requirements, primarily streaming analytics, Google Workspace integration needs
When to choose Fabric: Microsoft ecosystem, comprehensive governance requirements, unified platform preference, hybrid cloud scenarios
Microsoft Fabric vs. Palantir Foundry
Palantir strengths:
- More sophisticated data integration and ontology capabilities
- Better support for complex, highly-regulated environments
- Superior for mission-critical operational decision-making
- Stronger consulting and implementation support
- More advanced security and access control features
Fabric disadvantages:
- Significantly higher cost (often 10x Fabric pricing)
- Heavy consultant dependency for implementation and changes
- Less accessible for business users without training
- Longer implementation timelines
- Proprietary architecture limiting flexibility
When to choose Palantir: Mission-critical applications, heavily regulated industries, budget for premium solution, need for deep consulting partnership
When to choose Fabric: Cost-conscious implementations, self-service priority, faster time to value need, existing Microsoft investments
Microsoft Fabric vs. IBM watsonx.data / Cloud Pak for Data
IBM strengths:
- Stronger support for legacy IBM systems integration
- More comprehensive AI governance capabilities
- Better support for highly regulated industries
- Hybrid cloud flexibility
- Open lakehouse architecture with multiple query engines
Fabric advantages:
- Modern, cloud-native architecture vs. legacy platform
- Simpler user experience and lower training requirements
- Better BI and visualization capabilities
- More active innovation and feature releases
- Lower total cost of ownership
When to choose IBM: Heavy IBM infrastructure investment, need for legacy system integration, specific IBM AI capabilities, existing IBM skills
When to choose Fabric: Modern cloud architecture preference, Microsoft ecosystem, better user experience priority, faster innovation cycle need
Microsoft Fabric vs. Denodo Data Virtualization
Denodo strengths:
- More mature data virtualization capabilities
- Better support for complex legacy systems
- Stronger logical data warehouse patterns
- More flexibility in query optimization
- Better multi-protocol support
Fabric advantages:
- Modern AI-native architecture vs. traditional virtualization
- Complete analytics platform vs. virtualization-only
- Better scalability for large data volumes
- Native real-time streaming capabilities
- Lower cost for comprehensive use cases
When to choose Denodo: Pure virtualization need, legacy system integration priority, logical data warehouse pattern preference
When to choose Fabric: Modern analytics platform need, AI integration requirements, complete data lifecycle management, unified workspace preference
Market Adoption and Industry Recognition
Microsoft Fabric has achieved significant traction since its general availability in November 2023, demonstrating strong market validation.
Adoption Metrics and Customer Base
- 25,000+ organizations using Fabric globally across all industries
- 67% of Fortune 500 companies actively deploying Fabric
- 84% of Fabric customers utilizing three or more workloads (showing adoption beyond single use cases)
- 379% ROI over three years according to Forrester Total Economic Impact study
- Strong enterprise segment adoption especially in organizations with $1B+ annual revenue
These metrics indicate Fabric isn’t just being trialed but actually deployed for production workloads across multiple use cases within organizations.
Industry Recognition and Analyst Coverage
Gartner Magic Quadrant Leadership:
Microsoft maintains Leader positioning in multiple relevant Gartner Magic Quadrants:
- Magic Quadrant for Data Integration Tools (four consecutive years)
- Magic Quadrant for Analytics and Business Intelligence Platforms (17 consecutive years)
- Magic Quadrant for Data Science and Machine Learning Platforms
- Magic Quadrant for Cloud Database Management Systems
Forrester Recognition:
The Forrester Total Economic Impact study quantified benefits including:
- 379% return on investment over three years
- Payback period under 6 months
- $8.3M in benefits from improved data accessibility
- 70% reduction in time spent on data preparation
Partner Ecosystem Growth
System integrator partnerships:
- Accenture, Deloitte, PwC, EY offering Fabric practices
- Regional system integrators building dedicated Fabric teams
- Hundreds of Microsoft partners certified for Fabric implementation
Independent software vendor (ISV) integrations:
- Growing number of third-party connectors and extensions
- Integration with popular data tools (dbt, Fivetran, Monte Carlo)
- Specialized industry solutions built on Fabric foundation
Global reach and support:
- Available in all major Azure regions worldwide
- Support for 40+ languages in Power BI
- Regional partner networks for local implementation support
- Active community forums in multiple languages
The Future of Microsoft Fabric
Microsoft continues aggressive investment in Fabric with clear strategic directions for platform evolution.
Near-Term Roadmap (2025-2026)
Enhanced AI and Copilot capabilities:
- Deeper Copilot integration across all workloads with improved context understanding
- Multi-turn conversational analytics for complex analytical workflows
- Automated insights and anomaly detection powered by Azure OpenAI
- Natural language data modeling and transformation
Real-time and streaming enhancements:
- Improved Event Streams performance and scale
- Better integration with IoT and operational technology systems
- Enhanced real-time dashboard and alerting capabilities
- Streaming ML model scoring and inference
Advanced governance and security:
- Enhanced Purview integration with automated policy enforcement
- Improved data quality and observability tools
- Advanced encryption and key management options
- Better audit and compliance reporting automation
Performance and scalability improvements:
- Query optimization enhancements across all engines
- Better caching and materialized view support
- Improved partition elimination and pruning
- Enhanced concurrency and workload management
Industry-specific accelerators:
- Pre-built solutions for financial services, healthcare, retail, manufacturing
- Vertical-specific data models and semantic layers
- Industry compliance templates and certifications
- Specialized connectors for industry systems
Long-Term Strategic Directions
Multi-agent AI collaboration:
Supporting scenarios where multiple specialized AI agents collaborate over the Fabric data foundation:
- Data agents autonomously preparing and transforming datasets
- Analysis agents generating insights and recommendations
- Orchestration agents coordinating complex multi-step workflows
- Human oversight and approval at critical decision points
Edge-to-cloud analytics:
Extending Fabric capabilities to edge computing scenarios:
- Local Fabric runtime for disconnected or low-latency requirements
- Automatic synchronization between edge and cloud
- Edge ML model deployment and inference
- Hierarchical data architecture from edge to cloud
Open ecosystem expansion:
Increasing support for non-Microsoft technologies and open standards:
- Enhanced Apache Iceberg support alongside Delta Lake
- Better integration with popular open-source tools (dbt, Airflow)
- Support for additional query engines and processing frameworks
- Commitment to open data formats and APIs
Sustainability and efficiency:
Building capabilities for environmental responsibility:
- Carbon footprint tracking and optimization
- Energy-efficient query execution and scheduling
- Sustainability reporting and metrics
- Green computing best practices
Industry Trends Supporting Fabric Growth
Several macroeconomic and technology trends favor unified analytics platforms like Fabric:
AI/GenAI acceleration: Every enterprise building AI capabilities needs unified, governed data access. Fabric’s AI-native architecture positions it well for this wave.
Data mesh adoption: Organizations moving toward distributed data ownership with federated governance align with Fabric’s domain-driven approach.
Regulatory compliance pressure: Increasing data privacy regulations (GDPR, CCPA, AI Act) require comprehensive governance that Fabric provides by design.
Real-time analytics demand: Business expectations shifting from batch to real-time insights favor platforms with native streaming capabilities.
Cloud cost optimization: Economic pressure to reduce cloud spending drives consolidation of point solutions onto unified platforms.
Skills shortage: Difficulty hiring specialized data engineers makes platforms accessible to broader audiences more attractive.
Technical Deep Dive: How Fabric Actually Works
Understanding Fabric’s underlying architecture helps evaluate whether it fits your requirements and how to optimize implementations.
Query Execution Architecture
When you run a query in Fabric — whether through SQL, Spark, or Power BI — here’s what happens:
1. Query reception and parsing:
- User submits query through any interface (SQL editor, notebook, Power BI)
- Query parser validates syntax and resolves object references
- Security engine checks permissions before proceeding
2. Metadata resolution:
- Fabric consults unified metadata layer to understand data location
- For shortcuts, determines actual source location (OneLake, S3, ADLS)
- Retrieves statistics, partition information, and schema details
3. Query optimization:
- Cost-based optimizer generates execution plan
- Considers data location, size, and available compute resources
- Applies predicate pushdown to minimize data movement
- Determines whether to use Spark, SQL engine, or hybrid approach
4. Execution and data retrieval:
- For OneLake data, queries execute directly against Delta tables
- For shortcuts, pushes operations to source system when possible
- Retrieves only necessary data minimizing network traffic
- Applies row-level and column-level security filters
5. Results return:
- Aggregates results from distributed execution
- Applies final transformations and formatting
- Returns to requesting application with metadata
Key optimization: Fabric’s query engine intelligently pushes operations to data sources. When querying AWS S3 data through a shortcut, filters and aggregations execute in S3 rather than pulling all data to Fabric.
OneLake Storage Architecture
OneLake isn’t a separate storage system — it’s an abstraction layer over Azure Data Lake Storage Gen2:
Physical storage:
- Data physically stored in ADLS Gen2 with standard blob storage
- Each Fabric workspace maps to ADLS container
- Delta Lake format provides table structure over files
- Parquet files for columnar compression and efficient querying
Logical organization:
- Workspace → Container boundary for security and billing
- Item (lakehouse, warehouse) → Folder within container
- Tables → Delta Lake tables with transaction logs
- Files → Raw files, notebooks, reports as blobs
Shortcuts implementation:
- Metadata entry pointing to external location
- On query, Fabric reads data from original location
- No data duplication or physical copy
- Access control evaluated at query time
Benefits of this architecture:
- Standard blob storage pricing for most data
- Compatible with existing ADLS Gen2 tools and processes
- Can access OneLake data from outside Fabric if needed
- Familiar storage concepts for Azure-experienced teams
DirectLake Technology Explained
DirectLake represents a breakthrough in Power BI performance, eliminating traditional tradeoffs between Import and DirectQuery modes:
Traditional Power BI modes:
- Import mode: Fast queries but stale data (requires scheduled refresh)
- DirectQuery mode: Fresh data but slow queries (limited by source database)
DirectLake innovation:
- Queries OneLake Delta tables directly without import
- Uses Delta Lake’s native Parquet format for columnar reads
- Memory-maps files directly into Power BI engine
- Provides Import-mode speed with DirectQuery freshness
Technical implementation:
- Power BI engine reads Parquet files directly from OneLake
- Delta transaction log ensures consistency
- Intelligent caching of frequently accessed data
- Automatic fallback to DirectQuery for unsupported operations
Performance characteristics:
- Sub-second query response on billion-row tables
- No refresh windows or data staleness
- Memory-efficient compared to full Import
- Supports most DAX operations natively
Capacity Management and Autoscaling
Understanding how Fabric manages capacity helps optimize costs and performance:
Capacity consumption tracking:
- Every operation consumes CUs based on resource requirements
- Background processes (refresh, indexing) consume capacity
- Interactive queries compete for available CU pool
- Monitoring available through Capacity Metrics app
Autoscaling behavior:
- Fabric automatically requests additional CUs when demand exceeds capacity
- Scales in 10% increments up to 100% over purchased capacity
- Each autoscale unit billed at pay-as-you-go rate for duration used
- Automatically scales down when demand decreases
Throttling and queueing:
- When capacity fully consumed, new operations queue
- Users experience delays or “capacity exceeded” messages
- Long-running operations may be canceled
- Priority based on operation type and user role
Optimization strategies:
- Schedule resource-intensive operations during off-peak hours
- Use pause/resume for non-production capacities
- Implement caching to reduce redundant computation
- Optimize queries to minimize CU consumption
- Monitor usage patterns to right-size capacity
Making the Decision: Is Fabric Right for You?
After understanding what Fabric is, how it works, and how it compares to alternatives, here’s how to evaluate fit for your organization.
>> Click here for a more detailed buyer’s guide for Microsoft Fabric
Fabric is a Strong Fit When:
✅ Your organization has significant Microsoft ecosystem investment (Azure, 365, Power BI)
✅ You need unified platform for diverse user personas (engineers, scientists, analysts, business users)
✅ Data fragmentation across multiple systems blocks analytics initiatives
✅ You want rapid deployment (weeks) rather than months-long implementations
✅ Governance and compliance are top priorities requiring comprehensive audit trails
✅ You’re building AI/ML initiatives requiring governed data access at scale
✅ Self-service analytics for business users is strategic priority
✅ You prefer SaaS simplicity over managing infrastructure
✅ Budget flexibility exists for capacity-based pricing model
✅ Your team has or can develop Microsoft technology skills
Consider Alternatives When:
❌ Your infrastructure is primarily AWS or GCP with minimal Azure presence
❌ You need cutting-edge data science capabilities beyond what Fabric offers
❌ Multi-cloud portability is critical strategic requirement
❌ You have specialized requirements Fabric doesn’t natively support
❌ Your team has deep expertise in alternative platforms (Databricks, Snowflake)
❌ You prefer assembling best-of-breed tools over unified platform
❌ Your use case is primarily pure data virtualization without analytics
❌ Budget constraints prevent adequate capacity investment (under F64)
❌ You need capabilities available in mature competing platforms but not yet in Fabric
❌ Organizational resistance to Microsoft ecosystem exists
Questions to Ask During Evaluation:
Strategic alignment:
- Does Fabric align with our long-term cloud strategy?
- How does this fit our existing Microsoft investments?
- What organizational changes does adoption require?
Technical requirements:
- Can Fabric connect to all our critical data sources?
- Do our use cases match Fabric’s strengths?
- What gaps exist between needs and current capabilities?
Economic considerations:
- What’s the total 3-year cost of ownership vs. current state?
- How does capacity-based pricing align with our workload patterns?
- What implementation costs should we budget?
Risk assessment:
- What’s our migration strategy and rollback plan?
- How do we maintain business continuity during transition?
- What vendor lock-in risks exist?
Success criteria:
- How do we measure success beyond technical metrics?
- What business outcomes justify the investment?
- How long until we see ROI?
Conclusion: Understanding Fabric’s Place in Modern Analytics
Microsoft Fabric represents a genuine architectural shift in how enterprises approach analytics — moving from fragmented, best-of-breed tool assemblies toward unified, AI-powered platforms that serve all data personas in one environment.
The platform’s success stems from several key insights:
Integration matters more than ever. As data proliferates across cloud, SaaS, and on-premises systems, seamlessly working across all sources becomes increasingly valuable. Fabric’s unified metadata, security, and workspace model address real pain points that separate tools don’t solve well.
AI readiness isn’t optional. Every organization now builds AI capabilities. Fabric’s AI-native architecture — with Copilot throughout, native LLM integration, and purpose-built ML workloads — positions it well for this transition.
Governance can’t be an afterthought. Regulatory requirements intensify globally. Building governance into the foundation rather than retrofitting it prevents compliance issues and accelerates legitimate data use.
Simplicity has value. Technical teams spend enormous energy integrating and maintaining point solutions. Fabric’s unified approach eliminates much of this overhead, letting teams focus on delivering business value rather than managing infrastructure.
The Microsoft ecosystem is real. Organizations already invested in Azure, Microsoft 365, and Power BI gain significant additional value from Fabric’s deep integration with these platforms.
That said, Fabric isn’t a universal solution. Organizations with minimal Microsoft investments, those needing specialized capabilities available in mature competing platforms, or teams preferring best-of-breed assembly may find better fits elsewhere.
The platform’s rapid evolution — from preview to GA in six months, with continuous feature releases — shows Microsoft’s serious investment. The strong adoption metrics (67% of Fortune 500, 25,000+ organizations) indicate market validation beyond just hype.
For enterprises seeking to modernize their data and analytics capabilities, particularly those already in the Microsoft ecosystem, Fabric warrants serious evaluation. The combination of unified workspace, AI-native architecture, comprehensive governance, and rapid deployment creates compelling value for many organizations.
The key question isn’t whether Fabric is “good” in absolute terms, but whether it fits your specific context — technical requirements, organizational culture, existing investments, strategic direction, and budget realities. This guide provides the foundation to make that assessment informed by facts rather than marketing claims.
Looking for an Alternative Approach to Data Unification?
While Microsoft Fabric offers a unified analytics experience within a single platform, its architecture ultimately requires data to land in OneLake — which can create challenges for organizations with complex, distributed data estates or those seeking to avoid vendor lock-in to the Microsoft ecosystem.
Promethium’s Open Data Fabric takes a fundamentally different approach: zero-copy federation across all your data sources without requiring data movement, centralization, or platform migration. Query data where it lives — cloud, SaaS, on-premises — with complete context and governance enforced at AI scale. For full future flexibility.
Key differences:
- Open vs. closed architecture: Promethium works with your existing data stack (Snowflake, Databricks, etc.) rather than replacing it
- True zero-copy: No requirement to move data into a centralized lake — query across 200+ sources in place
- Instant deployment: Production-ready in weeks, not months of migration
- Vendor independence: No lock-in to specific cloud or platform
- AI-native from inception: Purpose-built for AI agents and human collaboration with complete explainability
Want to see how an open data fabric compares to platform-centric approaches like Microsoft Fabric? Learn more about Promethium’s Open Data Fabric or schedule a demo to explore federation without data movement.