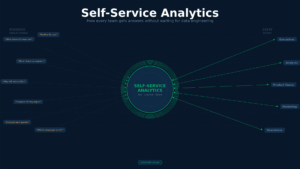
Every self-service analytics vendor claims to democratize data, enable business users, and eliminate IT bottlenecks. The marketing converges while the actual platforms diverge — Tableau optimizes for visual storytelling, Power BI for Microsoft ecosystem integration, Qlik for associative exploration, Looker for code-based governance.
Choosing the wrong platform creates predictable problems. Deploy Tableau when you need Microsoft integration, and you’ll fight ecosystem friction. Deploy Power BI when you need sophisticated visualizations, and analysts will hit limitations. Deploy Qlik when users expect traditional BI, and they’ll struggle with the associative paradigm.
This guide compares leading BI vendors on dimensions that actually matter — not feature checklists but use case fit, user persona alignment, and total cost of ownership and how they fit into your self-service strategy. The goal isn’t declaring winners but matching platforms to your specific requirements. For a broader analysis of different approaches including conversational analytics, visit this guide.
The inevitable rise of self-service data management. Get your complimentary copy of the Gartner report.
Vendor Overview: What Each Platform Optimizes For
Understanding vendor positioning clarifies which platform fits your needs before diving into feature matrices.
Tableau: Visual Analytics and Exploration
Core Positioning: Market leader in visual analytics and data exploration for analyst teams.
What They Optimize For:
- Intuitive visual exploration through drag-and-drop interactions
- Sophisticated visualizations beyond basic charts (advanced geospatial, custom shapes, animated transitions)
- Flexible ad-hoc analysis for data professionals
- Visual storytelling and presentation-quality dashboards
Ideal Customer Profile:
- Organizations prioritizing data storytelling and visual communication
- Data analyst teams needing powerful, flexible visualization capabilities
- Enterprises where analytics quality matters more than cost per user
- Companies with complex analytical requirements beyond standard reporting
Primary User Persona: Data analysts, BI developers, analytics professionals comfortable learning sophisticated tools
Deployment Model: Cloud (Tableau Online), on-premise (Tableau Server), or hybrid
Pricing Approach: Premium positioning — Creator licenses ~$70/user/month, Explorer ~$42/month, Viewer ~$15/month
Microsoft Power BI: Microsoft Ecosystem Integration
Core Positioning: Cost-effective enterprise BI deeply integrated with Microsoft stack.
What They Optimize For:
- Tight integration with Excel, Office 365, Azure, Teams, SharePoint
- Familiar interface reducing learning curve for Excel users
- Cost-effective deployment at enterprise scale
- Strong semantic modeling through DAX and Power Query
Ideal Customer Profile:
- Microsoft-centric organizations standardized on Office 365 and Azure
- Enterprises needing cost-effective BI for thousands of users
- Teams with strong Excel skills wanting familiar paradigms
- Organizations requiring embedded analytics in Teams or SharePoint
Primary User Persona: Business analysts comfortable with Excel, finance teams, operations managers
Deployment Model: Cloud (Power BI Service), on-premise (Power BI Report Server), embedded (Power BI Embedded)
Pricing Approach: Aggressive pricing — Pro licenses ~$14/user/month (increased April 2025), Premium Per User ~$24/month, Premium capacity-based ~$5,000/month
Qlik Sense: Associative Discovery
Core Positioning: Associative analytics platform enabling non-linear exploration and relationship discovery.
What They Optimize For:
- Associative engine revealing hidden data relationships
- Non-linear exploration where any selection shows all related data
- In-memory processing for fast interaction
- Self-service app creation by business users
Ideal Customer Profile:
- Organizations needing to discover unexpected patterns and relationships
- Teams analyzing complex data with multiple inter-related dimensions
- Enterprises valuing exploration over governed dashboards
- Companies with users comfortable with different analytical paradigms
Primary User Persona: Power users and citizen developers creating self-service apps
Deployment Model: Cloud (Qlik Sense SaaS), on-premise (Qlik Sense Enterprise), hybrid
Pricing Approach: Professional licenses ~$70-150/user/month, Analyzer licenses ~$30-50/month
Looker (Google Cloud): Code-Based Governance
Core Positioning: Engineering-first BI platform emphasizing governed semantic layers and metric consistency.
What They Optimize For:
- LookML semantic modeling as code with version control
- Strict metric governance ensuring consistency
- Git integration for collaboration and testing
- Cloud data warehouse optimization (BigQuery, Snowflake, Redshift)
Ideal Customer Profile:
- Engineering-led data teams comfortable with code-based workflows
- Organizations requiring strict metric governance across departments
- Cloud-native companies already using Google Cloud Platform
- Teams treating analytics infrastructure as software
Primary User Persona: Analytics engineers, data engineers, technical analysts
Deployment Model: Cloud-only (part of Google Cloud Platform)
Pricing Approach: Custom pricing based on usage and deployment scale
MicroStrategy: Enterprise-Grade Governed BI
Core Positioning: Comprehensive enterprise BI platform emphasizing governance, security, and scale.
What They Optimize For:
- Highly governed enterprise reporting environments
- Pixel-perfect reports and production dashboards
- Mobile-first analytics with native apps
- Comprehensive security and compliance features
Ideal Customer Profile:
- Large enterprises with strict governance requirements
- Financial services and healthcare needing compliance capabilities
- Organizations prioritizing security and audit over flexibility
- Companies with dedicated BI teams managing platform
Primary User Persona: Enterprise BI administrators, report developers, compliance-focused organizations
Deployment Model: Cloud, on-premise, or hybrid
Pricing Approach: Enterprise-focused pricing with custom quotes
Feature Comparison Matrix
Understanding feature parity and differentiation helps narrow vendor selection.
| Feature Category | Tableau | Power BI | Qlik Sense | Looker | MicroStrategy |
|---|---|---|---|---|---|
| Data Connectivity | |||||
| Pre-built Connectors | 100+ native | 200+ (including custom) | 100+ native | 60+ (warehouse-focused) | 200+ |
| Real-time Connections | ✓ (live queries) | ✓ (DirectQuery) | ✓ (live connections) | ✓ (always live) | ✓ |
| Data Refresh Options | Extract, Live, Hybrid | Import, DirectQuery, Composite | In-memory, DirectQuery | Real-time only | Intelligent Cubes, Live |
| Multi-source Joins | ✓ (cross-database) | ✓ (composite models) | ✓ (associative joins) | ✓ (through LookML) | ✓ |
| Semantic Layer | |||||
| Semantic Modeling | Calculated fields, LOD | DAX measures, Power Query | Master items, variables | LookML (code-based) | Attributes, metrics, facts |
| Reusable Metrics | ✓ (published data sources) | ✓ (shared datasets) | ✓ (master items) | ✓✓ (LookML definitions) | ✓✓ (centralized metrics) |
| Version Control | Basic | Basic | Basic | ✓✓ (Git integration) | Basic |
| Data Preparation | |||||
| Built-in ETL | Tableau Prep | Power Query / Dataflows | Data Manager | dbt integration | Data Wrangler |
| Data Quality Features | Basic profiling | Column quality, distribution | Data profiling | Through dbt | Data quality checks |
| Self-Service Prep | ✓ (Tableau Prep) | ✓✓ (Power Query) | ✓ (Data Manager) | Limited | Limited |
| Visualization | |||||
| Chart Types | 20+ with extensive customization | 30+ standard, custom visuals | 20+ standard | 15+ standard | 50+ comprehensive |
| Custom Visualizations | ✓✓ (Extensions API) | ✓✓ (Custom Visuals) | ✓ (Extensions) | ✓ (Custom viz) | ✓ |
| Geospatial | ✓✓ (advanced mapping) | ✓ (built-in maps) | ✓ (GeoAnalytics) | ✓ (basic mapping) | ✓ (advanced mapping) |
| Animation | ✓ (Pages) | Basic | ✓ (timeline) | Limited | Limited |
| User Experience | |||||
| Drag-and-Drop | ✓✓ (intuitive) | ✓ (Excel-like) | ✓ (app creation) | Limited (consumption) | ✓ (report design) |
| Natural Language | Tableau Ask Data | Q&A | Insight Advisor | Basic search | Voice analytics |
| Mobile Experience | Tableau Mobile app | Power BI Mobile app | Qlik Sense Mobile | Mobile-responsive | MicroStrategy Mobile |
| Collaboration | Slack, Teams integration | ✓✓ (Teams native) | Qlik collaboration | Slack integration | Comments, annotations |
| AI & Analytics | |||||
| Automated Insights | Explain Data | Quick Insights, Anomaly Detection | Insight Advisor | Basic anomaly detection | HyperIntelligence |
| Forecasting | ✓ (built-in models) | ✓ (AutoML) | ✓ (Advanced Analytics) | Through integrations | ✓ (predictive models) |
| What-If Analysis | ✓ (parameters) | ✓✓ (DAX scenarios) | ✓ (variables) | Through calculations | ✓ (simulation) |
| ML Integration | TabPy, Einstein Discovery | Azure ML, AutoML | AutoML, R/Python | BigQuery ML, Vertex AI | MicroStrategy AutoML |
| Governance & Security | |||||
| Row-Level Security | ✓ (data source level) | ✓✓ (DAX expressions) | ✓ (section access) | ✓ (LookML access grants) | ✓✓ (comprehensive) |
| Data Lineage | Basic | Basic | Basic | ✓ (LookML tracking) | ✓ (comprehensive) |
| Audit Logging | ✓ (repository logs) | ✓ (admin logs) | ✓ (audit logs) | ✓ (system activity) | ✓✓ (detailed auditing) |
| Certifications | SOC 2, ISO, HIPAA | ✓✓ (comprehensive) | SOC 2, ISO, GDPR | GCP certifications | ✓✓ (extensive) |
| Deployment | |||||
| Cloud Option | Tableau Online | Power BI Service | Qlik Sense SaaS | Cloud-only | MicroStrategy Cloud |
| On-Premise | Tableau Server | Report Server | Qlik Sense Enterprise | Not available | MicroStrategy Server |
| Embedded | Embedded API | Power BI Embedded | Qlik Embedding | Looker Embedded | Embedding SDK |
| Pricing | |||||
| Entry Price Point | $$$ (Premium) | $ (Aggressive) | $$ (Moderate) | $$$ (Custom) | $$$ (Enterprise) |
| Licensing Model | Per user (Creator/Explorer/Viewer) | Per user / Capacity | Per user (Professional/Analyzer) | Custom enterprise | Per user / Server |
| Free Tier | Tableau Public | Power BI Desktop | Qlik Sense Desktop | None | Trial only |
Legend:
✓ = Supported
✓✓ = Strong differentiator
$ = Low cost
$$ = Moderate cost
$$$ = Premium pricing
Detailed Vendor Analysis
Tableau Self-Service Analytics
Strengths:
Visual Exploration Excellence: Tableau’s VizQL language translates drag-and-drop actions into optimized queries, making sophisticated visual analysis accessible. The “Show Me” feature suggests appropriate visualizations based on selected data, while level-of-detail (LOD) calculations enable complex analytical scenarios without altering underlying data sources.
Flexibility and Power: Unlike tools forcing users into templates, Tableau provides nearly unlimited customization. Analysts can create advanced visualizations (density plots, control charts, custom polygons) that would require extensive coding in other platforms.
Strong Community: The largest BI community (#DataFam) shares templates, best practices, and extensions. Tableau Public serves as both learning platform and showcase, with thousands of public visualizations demonstrating what’s possible.
Enterprise Deployment: Tableau Server provides robust on-premise deployment with comprehensive security, scalability handling thousands of concurrent users, and flexible licensing accommodating different user types.
Weaknesses:
Cost: Premium pricing makes Tableau expensive at enterprise scale. Creator licenses required for content development cost significantly more than competing platforms.
Learning Curve: While intuitive for basic visualizations, mastering Tableau requires understanding calculations, data blending, and optimization techniques. New users often create inefficient workbooks impacting performance.
Governance Challenges: Flexibility creates governance risks. Without discipline, organizations accumulate hundreds of overlapping dashboards with inconsistent metrics. Tableau’s governance tools exist but require active management.
Data Preparation Limitations: Tableau Prep is improving but less capable than dedicated ETL tools or Power Query. Complex transformations often require external data preparation.
Ideal Use Cases:
- Financial Analysis: Investment firms using Tableau for portfolio analysis, market trend visualization, and client reporting where visual quality matters
- Healthcare Analytics: Hospital networks creating patient outcome dashboards, operational efficiency reports, and clinical research visualizations
- Sales Performance: Enterprise sales organizations building territory analysis, pipeline visualization, and quota attainment dashboards
- Academic Research: Universities and research institutions creating data-driven publications requiring publication-quality visualizations
Power BI Self-Service Analytics
Strengths:
Microsoft Ecosystem Integration: Native integration with Excel, Teams, SharePoint, Azure, and Dynamics creates seamless experience for Microsoft-standardized organizations. Power BI embedded in Teams enables collaborative analytics within existing workflows.
Cost-Effectiveness: Aggressive pricing makes Power BI accessible at enterprise scale. Organizations can deploy to thousands of users for fraction of Tableau or Qlik costs. Pro licenses at $14/user/month (up from $10 as of April 2025) remain significantly cheaper than competitors.
Familiar Interface: Excel users feel immediately comfortable with Power Query and DAX, reducing training requirements. The ribbon interface mirrors Office applications.
Rapid Development: Power Query enables fast data transformation while DAX provides powerful calculation capabilities. Desktop application is free, lowering barriers to exploration.
AI Capabilities: Quick Insights, Key Influencers, and Anomaly Detection provide automated analytical capabilities accessible to business users. Azure ML integration enables advanced scenarios.
Weaknesses:
Visualization Limitations: While improving, Power BI’s visualization capabilities lag Tableau’s flexibility. Creating custom or complex visualizations requires workarounds or custom visuals from marketplace.
DAX Complexity: Despite Excel familiarity, DAX has steep learning curve for advanced scenarios. Performance optimization requires deep understanding of evaluation contexts and storage engine behavior.
Performance at Scale: Large datasets and complex models can struggle with DirectQuery performance. Premium capacity often required for acceptable performance with many concurrent users.
Governance Gaps: Row-level security and governance features exist but less mature than enterprise BI platforms. Organizations often discover governance limitations after broad deployment.
Ideal Use Cases:
- Financial Planning: Finance teams building budget models, variance analysis, and forecasting dashboards leveraging Excel integration
- Operations Dashboards: Manufacturing plants monitoring production metrics, quality control, and equipment efficiency with real-time Azure IoT integration
- Sales Analytics: Sales teams analyzing pipeline, forecasting, and performance metrics integrated with Dynamics CRM
- Executive Reporting: Leadership teams consuming standardized KPI dashboards embedded in Teams and SharePoint
Qlik Sense Self-Service Analytics Features
Strengths:
Associative Engine: Qlik’s unique architecture where every data point knows its relationship to every other data point. Selecting any value instantly highlights related data across all charts while showing unrelated data in gray. This reveals patterns and relationships impossible to discover with traditional SQL-based tools.
Exploration Freedom: Unlike tools requiring pre-defined queries or drill paths, Qlik enables free-form exploration. Users can click any value in any chart and see how all other data relates without hitting dead ends or missing relationships.
In-Memory Performance: The Qlik indexing engine (QIX) loads data into memory with extreme compression, enabling fast interaction even with large datasets. User selections trigger instant recalculations across all visualizations.
Self-Service App Creation: Business users can create full applications (not just dashboards) combining data, visualizations, and narratives. The app concept encourages reusable analytical products rather than one-off dashboards.
Smart Search: Insight Advisor uses AI to suggest relevant visualizations based on user intent and data characteristics. Users can type questions and get automatically generated charts.
Weaknesses:
Associative Paradigm: The strength is also a weakness — users accustomed to traditional BI struggle with the associative model. Training required to understand white (selected), green (associated), and gray (excluded) visual language.
Visualization Aesthetics: Out-of-box charts appear dated compared to Tableau. Creating polished, presentation-quality visualizations requires significant effort.
Script Complexity: Qlik’s data loading script has steep learning curve. While powerful, it requires specialized skills different from SQL or traditional ETL.
Limited External Ecosystem: Smaller community and fewer extensions compared to Tableau or Power BI. Third-party integrations less common.
Ideal Use Cases:
- Supply Chain Analysis: Manufacturers analyzing complex supplier, component, and production relationships where associative discovery reveals bottlenecks
- Risk Management: Financial institutions exploring fraud patterns where unexpected relationships between entities signal suspicious activity
- Healthcare Quality: Hospitals analyzing patient outcomes where multiple factors (treatments, providers, demographics) interact in complex ways
- Customer Segmentation: Retailers discovering customer behavior patterns across products, channels, and timeframes
Looker Analytics
Strengths:
LookML Semantic Layer: LookML defines metrics, dimensions, and relationships as code, ensuring consistency across organization. Changes propagate instantly to all reports, eliminating metric confusion.
Version Control: Git integration treats analytics like software development. Teams collaborate on LookML models, review changes through pull requests, and test modifications before production deployment.
Metric Governance: Single definition of business logic enforces consistency. “Revenue” means the same thing whether accessed through Looker, exported to Excel, or consumed via API.
Cloud Warehouse Optimization: Looker generates efficient SQL optimized for BigQuery, Snowflake, and Redshift. It doesn’t move data but pushes processing to warehouses.
Developer-Friendly: API-first architecture enables embedding Looker analytics in custom applications. Developers can build sophisticated data applications on Looker’s backend.
Weaknesses:
LookML Barrier: Non-technical users can’t create content without data team support. LookML requires programming skills foreign to typical business analysts.
Limited Flexibility: Strict governance limiting ad-hoc customization frustrates power users wanting flexibility. Everything must conform to LookML model.
Visualization Simplicity: While functional, Looker’s visualizations lack sophistication of Tableau. Custom visualizations possible but require significant development.
Cost: Enterprise-focused pricing makes Looker expensive, especially for smaller deployments. Custom pricing lacks transparency of per-user alternatives.
Ideal Use Cases:
- SaaS Metrics: Technology companies defining product metrics (DAU, ARR, churn) centrally and consuming across teams
- E-Commerce Analytics: Online retailers ensuring consistent metric definitions across marketing, operations, and finance
- Data-as-a-Service: Companies embedding analytics in products for customers, leveraging Looker’s API and multi-tenancy
- Regulatory Reporting: Financial services requiring auditable, consistent metrics with complete lineage
MicroStrategy Self-Service Analytics
Strengths:
Enterprise Governance: Comprehensive security model with fine-grained access controls, extensive audit capabilities, and compliance features meeting strictest regulatory requirements.
Mobile-First: Native mobile apps (not web wrappers) provide offline access, push notifications, and mobile-optimized experiences. HyperIntelligence overlays insights on any mobile app.
Pixel-Perfect Reporting: Production-quality reports with precise formatting required for regulatory filings and external distribution. Financial statement formatting, complex headers, and exact spacing control.
Comprehensive Platform: Beyond BI, MicroStrategy provides data preparation, advanced analytics, embedded BI, and transaction capabilities in integrated platform.
Proven Scalability: Deployments supporting tens of thousands of users with guaranteed performance. Fortune 500 track record over decades.
Weaknesses:
Complexity: Comprehensive capabilities create complexity. Implementation requires specialized skills and significant effort. Learning curve steep for administrators and developers.
User Experience: Interface feels dated compared to modern tools. While functional, the experience doesn’t match Tableau’s polish or Power BI’s simplicity.
Cost Structure: Enterprise-focused pricing with complex licensing models. Total cost of ownership high compared to newer platforms.
Innovation Pace: Slower adoption of modern paradigms (cloud-native, natural language, AI) compared to newer vendors.
Ideal Use Cases:
- Financial Services Compliance: Banks meeting strict regulatory reporting requirements with auditable, pixel-perfect reports
- Healthcare HIPAA: Healthcare providers requiring comprehensive security, audit trails, and access controls
- Government Agencies: Public sector organizations with complex security requirements and established MicroStrategy deployments
- Insurance Claims: Insurance companies managing high-volume transaction processing with analytics
Adoption Considerations: Beyond Features
Technical capabilities matter, but adoption success depends on organizational factors often overlooked in vendor comparisons.
User Interface and Learning Curve
For Data Analysts:
- Tableau: Intuitive for analytical thinkers; learning curve for advanced features worthwhile
- Qlik: Requires mindset shift but powerful once understood
- Power BI: Familiar if you know Excel; struggles with complex scenarios
- Looker: Requires LookML skills — not self-service for analysts
- MicroStrategy: Powerful but dated interface; significant training required
For Business Users:
- Power BI: Easiest entry for Excel users; limited without training
- Tableau: Viewer experience excellent; creation requires training
- Qlik: Self-service apps work well; creation requires expertise
- Looker: Consumption straightforward; no creation capability
- MicroStrategy: Consumption functional; intimidating interface
Training Resources and Community
Tableau: Extensive free training through Tableau Public, eLearning, and community forums. Large consultant ecosystem. Vibrant community sharing templates and techniques.
Power BI: Massive YouTube community, Microsoft Learn platform, and free resources. Largest user base means most answered questions already online.
Qlik: Formal training programs and certification paths. Smaller community than Tableau/Power BI but dedicated. Qlik Continuous Classroom provides structured learning.
Looker: Google Cloud training integrated. Smaller community focused on technical users. Strong documentation for developers.
MicroStrategy: Traditional training programs and professional services. Established community of enterprise practitioners. Education focuses on certification paths.
Implementation Timeline
Power BI: Fastest initial deployment — download Desktop, start building. Governance and scale require more planning.
Tableau: Moderate deployment — intuitive creation but proper server setup and governance planning essential.
Qlik: Moderate to slow — associative model requires design thinking. App development faster than traditional BI.
Looker: Slow — LookML development time-intensive initially. Pays dividends in consistency and maintenance.
MicroStrategy: Slow — enterprise platform requiring significant architecture and implementation planning.
Total Cost of Ownership
License costs are only part of TCO. Consider:
Tableau:
- High per-user licensing
- Moderate infrastructure costs
- Low training costs (intuitive, strong community)
- Moderate governance costs (requires discipline)
- Total: High for large deployments
Power BI:
- Low per-user licensing ($14/month Pro as of April 2025)
- Low infrastructure costs (cloud-native)
- Low training costs (Excel familiarity, abundant resources)
- Moderate governance costs (maturing capabilities)
- Total: Lowest for Microsoft-centric organizations
Qlik:
- Moderate to high per-user licensing ($70-150/month Professional, $30-50/month Analyzer)
- Moderate to high infrastructure costs (in-memory requirements)
- High training costs (associative paradigm learning curve)
- Moderate governance costs
- Total: High, especially for Professional user deployments
Looker:
- High licensing (enterprise custom pricing)
- Low infrastructure costs (leverages existing warehouses)
- High training costs (LookML expertise required)
- Low governance costs (LookML enforces consistency)
- Total: High initially, lower long-term for metric-heavy organizations
MicroStrategy:
- High licensing (enterprise focus)
- Moderate to high infrastructure costs
- High training costs (comprehensive platform)
- Low governance costs (mature capabilities)
- Total: Highest, justified for complex enterprise requirements
Industry-Specific Vendor Fit
Different industries prioritize different capabilities, influencing optimal vendor choice.
Financial Services
Primary Requirements: Compliance, audit trails, pixel-perfect regulatory reporting, sophisticated calculations, strict governance
Best Fit: MicroStrategy for compliance-heavy reporting, Tableau for trading analytics, Looker for metric consistency
Why: Financial services balance regulatory requirements (favoring MicroStrategy/Looker) with analytical sophistication (favoring Tableau). Power BI adoption growing for cost reasons.
Healthcare
Primary Requirements: HIPAA compliance, patient privacy, role-based access, mobile access for clinicians, integration with EMR systems
Best Fit: Tableau for research and outcomes analysis, MicroStrategy for compliance, Qlik for patient journey analysis
Why: Healthcare values visual exploration (Tableau) for clinical research while requiring strict governance (MicroStrategy) for patient data. Qlik’s associative engine fits complex patient pathways.
Manufacturing
Primary Requirements: Real-time operational dashboards, supply chain visibility, IoT integration, quality control analytics
Best Fit: Power BI for cost-effective operational dashboards, Qlik for supply chain complexity, Tableau for quality analysis
Why: Manufacturing operations benefit from Power BI’s IoT integration and cost-effectiveness. Supply chain complexity favors Qlik’s associative discovery.
Retail
Primary Requirements: Customer segmentation, inventory optimization, omnichannel analytics, promotional analysis
Best Fit: Tableau for merchandising analysis, Power BI for store operations, Qlik for customer discovery
Why: Retail merchandising teams value Tableau’s visual capabilities. Store operations favor Power BI’s cost and simplicity. Customer analytics benefit from Qlik’s associative exploration.
Technology/SaaS
Primary Requirements: Product analytics, API integration, embedded analytics, metric governance, cloud-native deployment
Best Fit: Looker for metric governance and embedding, Tableau for product analytics, Power BI for internal operations
Why: SaaS companies prioritize metric consistency (Looker) and often embed analytics in products. Internal operations favor cost-effective Power BI.
Making the Decision: Evaluation Framework
Move from feature comparison to decision through structured evaluation matching vendors to requirements.
Step 1: Define Primary Use Case
Governed Enterprise Reporting
- Standardized dashboards consumed by broad organization
- Consistency and compliance over flexibility
- IT-managed platform with business user consumption
→ Strong Fit: MicroStrategy, Looker, Power BI
→ Poor Fit: Tableau (too flexible), Qlik (exploration-focused)
Analyst-Led Visual Exploration
- Data professionals building sophisticated analysis
- Visual quality and flexibility critical
- Advanced analytical capabilities required
→ Strong Fit: Tableau, Qlik
→ Poor Fit: Looker (consumption-focused), Power BI (limited advanced viz)
Cost-Effective Broad Deployment
- Thousands of users across organization
- Budget constraints significant
- Microsoft ecosystem standardization
→ Strong Fit: Power BI
→ Poor Fit: Tableau (cost), MicroStrategy (cost), Looker (cost)
Metric Governance and Consistency
- Multiple teams using different definitions
- Engineering-led data team
- Cloud data warehouse foundation
→ Strong Fit: Looker
→ Poor Fit: Tableau (governance requires discipline), Qlik (individual app focus)
Step 2: Assess User Skill Distribution
Primarily Data Analysts: Tableau, Qlik provide power and flexibility analysts value
Mix of Analysts and Business Users: Power BI balances capabilities with accessibility
Business Users Only: Focus on vendor-specific managed services or simpler consumption tools
Technical/Engineering Teams: Looker’s code-based approach appeals to this audience
Step 3: Evaluate Existing Technology Stack
Microsoft-Centric (Office 365, Azure, Teams): Power BI provides seamless integration
Google Cloud Platform: Looker deeply integrated with GCP
Multi-Cloud or Cloud-Agnostic: Tableau, Qlik, MicroStrategy work across environments
Existing Data Warehouse (Snowflake, Databricks, Redshift): All vendors support, Looker optimized
Step 4: Calculate 3-Year TCO
Include all costs:
- License fees (per user or capacity)
- Infrastructure (servers, storage, cloud costs)
- Implementation (services, consulting)
- Training (formal programs, time investment)
- Support (vendor support, internal staff)
- Governance (tools, processes, ongoing management)
Lowest license cost rarely means lowest TCO.
Step 5: Pilot with Real Users and Data
Don’t decide based on vendor demos with sample data. Pilot finalists with:
- Actual users representing different skill levels
- Real business questions and use cases
- Production-scale data volumes
- Integration with actual data sources
- Security and governance requirements
Measure:
- Time to first insight
- User satisfaction and adoption
- Performance with real data
- Governance capability gaps
- Total effort required for deployment
The Bottom Line
No self-service analytics vendor dominates across all dimensions. Each optimizes for specific use cases, user personas, and organizational priorities.
What does it take to build an enterprise data analytics agent?
Read the blueprint from BARC
Choose Tableau when: Visual exploration and analytical sophistication matter more than cost. Data analyst teams need powerful, flexible tools. Visual storytelling is strategic capability.
Choose Power BI when: Microsoft ecosystem integration and cost-effectiveness are priorities. Organization standardized on Office 365 and Azure. Thousands of users need access at low per-user cost.
Choose Qlik when: Discovering unexpected relationships in complex data is critical. Associative exploration provides value over traditional BI. Users willing to learn different analytical paradigm.
Choose Looker when: Metric consistency and governance are paramount. Data team has engineering skills for LookML development. Cloud warehouse foundation exists. Embedding analytics in products required.
Choose MicroStrategy when: Compliance, security, and audit requirements are extensive. Pixel-perfect reporting critical. Existing MicroStrategy investment and expertise. Enterprise scale with guaranteed performance.
For many organizations, the answer isn’t choosing one platform exclusively. Modern analytics architectures combine:
- Power BI for broad organizational reporting and Microsoft integration
- Tableau for analyst teams requiring advanced visual capabilities
- Looker for governed metric definitions consumed across tools
- Specialized platforms (Promethium) solving distributed data access before visualization
What matters is matching platform strengths to actual requirements — not chasing feature parity or lowest license costs. The right vendor depends on your primary use case, user composition, existing technology, and organizational priorities. But be aware of the latest trends that might shake up the self-service market.