
If you’re evaluating text-to-SQL solutions for enterprise deployment, you’ve likely encountered vendor claims of 85-90% accuracy backed by impressive benchmark numbers. You may have also encountered the uncomfortable reality when testing against your own schemas: accuracy that barely exceeds 10-30%.
This isn’t a data quality problem or an implementation error. It’s the fundamental gap between academic benchmarks and enterprise complexity — a gap the industry has been reluctant to discuss openly.
This guide provides the honest, technical assessment that marketing materials won’t: why GPT-4o achieves 86% on Spider 1.0 but only 6% on Spider 2.0 enterprise databases, how the five levels of context bridge this gap to 94-99% accuracy, and what evaluators must understand to make informed purchasing decisions.
Read our latest trend report on the state of Text-to-SQL
The Accuracy Reality: Benchmark vs. Enterprise Performance
Academic Benchmarks Create False Confidence
Current text-to-SQL benchmarks test simplified conditions that don’t reflect production environments. Spider 1.0, the industry standard, shows models achieving 85-86% execution accuracy with fine-tuned GPT-4 reaching 83-84%. These databases contain 10-20 tables with clean schemas and simple business logic — conditions that almost never exist in enterprise settings.
The BIRD benchmark provides slightly more realism, with GPT-4o achieving 52.54% overall accuracy (56% on simple questions, dropping to 35% on moderate complexity and 41% on hard questions). Human expert performance on BIRD reaches 92-93%, establishing the true ceiling and showing that external knowledge requirements and dirty data create significant challenges even for experienced data professionals.
State-of-the-art systems like Arctic-Text2SQL-R1 32B reach 71.83% on BIRD through sophisticated reasoning and multi-step filtering. This represents the current technical ceiling with massive model investment — and it’s still far from production-ready for enterprise deployment.
Enterprise Reality: The Performance Cliff
When confronted with actual enterprise conditions, accuracy collapses dramatically. Spider 2.0 enterprise benchmarks test on real-world enterprise database platforms, revealing peak accuracy of just 59% on Snowflake, 38% on multi-platform deployments, and 40% on DBT implementations. Most striking: GPT-4o’s overall success rate drops to 6% versus 86% on Spider 1.0, while o1-preview achieves 21.3% on Spider 2.0 versus 91.2% on Spider 1.0.
That’s not a typo. The same model achieves 86% on academic benchmarks but 6% on enterprise databases — a 93% accuracy drop.
Testing on private enterprise data with intricate schemas reveals off-the-shelf LLMs struggle significantly due to complex business queries requiring domain knowledge, lack of access to private training data, and schema complexity exceeding model context windows. Real-world production deployments report sobering results: Uber’s internal text-to-SQL achieves only 50% overlap with ground truth tables, while production accuracy studies show only 10-20% of AI-generated answers to open-ended questions against heterogeneous enterprise systems are accurate enough for business decisions.
The pattern is clear and consistent: academic benchmarks are poor predictors of enterprise performance.
Why the Gap Exists: Five Critical Factors
1. Schema Complexity Overwhelms Context Windows
Enterprise databases fundamentally differ from academic benchmarks in ways that break current LLM approaches. Academic benchmarks test schemas with 10-20 tables and 50-100 columns total, while enterprise reality involves 1,000+ columns per database spanning 100+ tables. Production examples tested include 1,251 tables with 750+ columns — scale that overwhelms even 128K context windows.
Naming conventions compound the problem. Enterprise schemas use non-intuitive abbreviations like consumer_1 and consumer_2 instead of customer_name, employ business-specific terminology absent from LLM training data, and hide semantics requiring domain knowledge. Relationship complexity adds another layer of difficulty, with multi-table joins spanning 5-10 tables, nested structures, hierarchical relationships, non-standard foreign key patterns, implicit joins, bridge tables, and many-to-many relationships.
Context window limitations make it impossible to include full enterprise schemas in prompts without exceeding token limits, introducing noise from irrelevant tables, losing critical information through truncation, and degrading performance as context increases. The fundamental problem: you can’t send 1,000 columns to an LLM and expect it to identify the relevant 5-10 for a given question.
2. Lack of Schema Grounding Triggers Hallucinations
Without explicit schema awareness, LLMs improvise — often incorrectly. The most common hallucination involves referencing non-existent tables and columns, where the model generates plausible-sounding names that don’t exist in the actual schema. Next come fabricated business metrics, creating calculations that seem reasonable but don’t match actual business definitions. Incorrect join logic follows, joining tables that shouldn’t be joined or using wrong join keys. Finally, missing critical filters — omitting WHERE clauses essential for correct results like excluding test data or applying appropriate date ranges.
The root cause is fundamental: LLMs generate from patterns rather than understanding specific schemas. They know what SQL syntax looks like and what table names tend to look like — but they don’t know YOUR schema. This creates a cascade effect: limited context leads to incomplete schema access, which leads to guessed joins and columns, which leads to failed queries, manual debugging, trust erosion, and ultimately tool abandonment.
The business risk extends beyond obvious errors. “Silent failures” where seemingly correct queries execute successfully but inform critical reports with wrong data pose greater danger than errors, because they appear correct while delivering incorrect business insights.
3. Business Logic vs. Technical Metadata Gap
The fundamental challenge isn’t SQL syntax — it’s semantic understanding. Every company defines core metrics differently. “Revenue” might mean recognized revenue, booked revenue, gross or net, including or excluding refunds — and these definitions vary not just company to company but department to department within enterprises. “Churn” calculations differ based on whether they count voluntary or total churn, the time period measured, and how pauses are handled. “Customer Acquisition Cost” depends on what’s included in acquisition costs and how attributions are handled.
Hidden business rules add another layer of complexity. Fiscal calendars differ from standard calendars. Inclusion and exclusion criteria apply for specific analyses. Data quality filters must be applied consistently. Dimensional hierarchies require specific rollup logic. The same question should produce the same answer as existing BI tools, but raw SQL access causes divergence because BI tools use curated semantic models while text-to-SQL generates from technical schemas. Business logic exists in the application layer, not the database itself.
Without comprehensive business context, organizations get technically correct SQL that produces business-incorrect answers.
4. Query Complexity Beyond Simple SELECT Statements
Enterprise queries involve sophisticated operations benchmarks don’t test:
Multi-Step Workflows:
- Multiple SQL queries in sequence, often exceeding 100 lines
- Intermediate results feeding subsequent queries
- Complex dependencies between query steps
Cross-Dialect Requirements:
- BigQuery, Snowflake, SQLite, Oracle — each with different syntax
- Dialect-specific functions and optimization patterns
- Platform-specific limitations and workarounds
Advanced Operations:
- Window functions (OVER, PARTITION BY, LAG/LEAD)
- Common Table Expressions (WITH clauses) for readability and reuse
- Complex aggregations requiring multi-step reasoning
- Recursive queries for hierarchical data
Efficiency Requirements:
Not just correct results, but performant queries that don’t strain data warehouses:
- Appropriate use of indexes and partitions
- Query pushdown to underlying sources
- Avoiding full table scans on large datasets
- Proper handling of data skew
5. Enterprise Data Characteristics
Real business data introduces challenges absent from clean benchmarks:
Dirty Data:
- Missing values requiring NULL handling
- Inconsistencies requiring CASE statements or data cleansing
- Data quality issues needing special handling logic
External Knowledge Requirements:
- Domain expertise not in LLM training data
- Business context about why certain filters matter
- Tribal knowledge about data quirks and exceptions
Performance Constraints:
- Queries must execute within acceptable time limits on large datasets
- Resource limitations on concurrent users
- Cost considerations for cloud data warehouses
Multiple Source Systems:
- Distributed data across cloud, on-premise, SaaS platforms
- Federation requirements across incompatible systems
- Governance and security across boundaries
These aren’t edge cases — they’re normal operating conditions for enterprise data environments.
Want to check whether your data is AI ready? Download our 15-question self-assessment checklist.
The Architectural Solution: Five Levels of Context Enable Production Accuracy
The accuracy gap isn’t a model problem — it’s an architecture problem. LLMs cannot derive business context from raw schemas. Organizations achieving production-grade accuracy (90%+) provide context through multiple integrated layers, not just “a semantic layer.”
The Five Levels of Context That Bridge the Gap
Understanding these levels helps explain why some implementations achieve 16% accuracy while others reach 90%+. Production systems require ALL five levels working together:
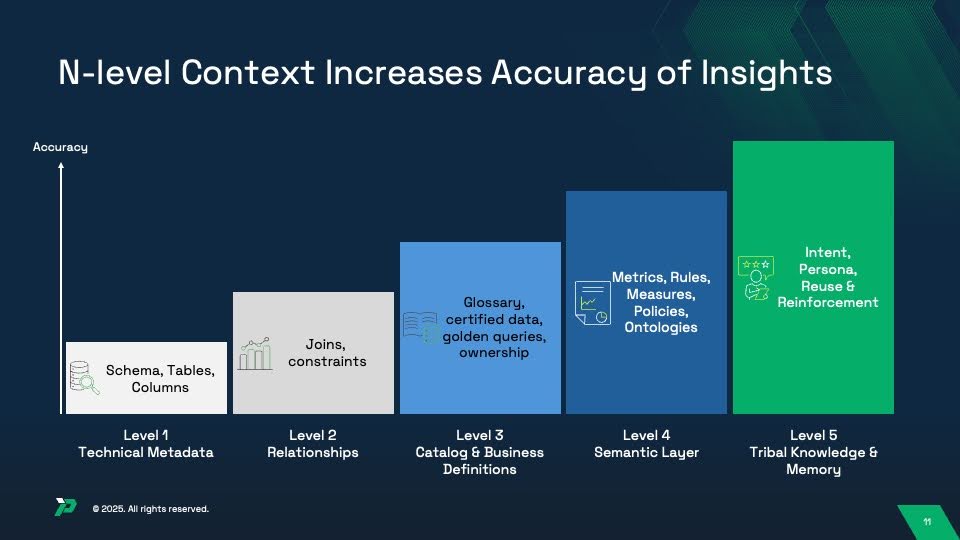
Level 1: Technical Metadata (Foundation)
What raw schemas provide:
- Database schemas, tables, columns, data types
- Basic table and column statistics (row counts, cardinality)
Accuracy Impact: 10-20% (baseline)
LLMs can see technical structure but lack understanding of relationships, business meaning, or logic. This is what academic benchmarks test — and why they predict poorly for enterprise reality.
Level 2: Relationships (Joins & Constraints)
What relationship mapping provides:
- Primary keys and foreign keys
- Valid join paths between tables
- Referential integrity constraints
- Cardinality rules (one-to-many, many-to-many)
Accuracy Impact: 20-40%
Eliminates hallucinated joins and incorrect table relationships. LLMs no longer guess which tables connect — they follow defined paths. Still missing: business meaning and calculation logic.
Level 3: Catalog & Business Definitions (Governance Layer)
What data catalogs and governance tools contribute:
- Business glossaries mapping technical names to business terms
- Certified datasets and trusted data sources
- Data ownership and stewardship information
- Golden queries showing “correct” ways to answer common questions
- Column descriptions and domain taxonomies
Accuracy Impact: 40-70%
Provides semantic understanding — what data means in business terms. LLMs now understand that cust_id means “customer” and which tables are trusted sources. Still missing: how to calculate metrics and apply business rules.
Level 4: Semantic Layer (Metrics, Rules & Policies)
What semantic layers and BI tools provide:
- Metric definitions (“revenue” formula, “churn” calculation)
- Business rules (fiscal calendars, inclusion/exclusion criteria)
- Dimensional hierarchies and rollup logic
- Access policies and row-level security
- Ontologies defining business concepts and relationships
Accuracy Impact: 70-90%
This is what most people mean by “semantic layer” — codified business logic that ensures consistent calculations. “Revenue” now means exactly one thing, calculated exactly one way. Still missing: learning from usage and adapting to context.
Level 5: Tribal Knowledge & Memory (Intent & Reinforcement)
What continuous learning and memory capture:
- User intent and persona-specific interpretations (finance vs. sales “revenue”)
- Query reuse patterns and successful answer templates
- User feedback on answer quality (thumbs up/down, corrections)
- Reinforcement learning from successful queries
- Historical context from past conversations
Accuracy Impact: 90%+
This is where systems become truly intelligent — learning from every interaction to improve over time. The system remembers that when Sarah from Finance asks about “revenue,” she means recognized revenue with specific exclusions, while Mike from Sales wants bookings. Research shows fine-tuning on business-specific query-SQL pairs achieves 95%+ accuracy, but this level goes beyond static training to continuous reinforcement and contextual memory.
Why “Just Add a Semantic Layer” Doesn’t Work
Many organizations implement BI semantic layers (Level 3) and wonder why text-to-SQL accuracy remains disappointing. Three common gaps:
Gap 1: Fragmented Context
Context lives in multiple places:
- Technical metadata in database schemas (Level 1)
- Relationship mappings in data models or ERDs (Level 2)
- Business definitions in data catalogs like Alation or Collibra (Level 3)
- Business logic in BI tools like Tableau, Looker, or dbt (Level 4)
- Tribal knowledge in analyst heads, documentation, and past queries (Level 5)
Problem: Each system has partial context. Text-to-SQL needs ALL five levels unified.
Solution: Context aggregation layer that pulls from existing sources rather than creating yet another silo.
Gap 2: Static Definitions
Even with Levels 1-4 implemented, static definitions don’t adapt to:
- Ambiguous questions requiring clarification
- New business terminology not in original definitions
- Schema changes requiring updated context
- User-specific or persona-specific interpretations of metrics
Problem: Rigid definitions break on edge cases and novel questions.
Solution: Level 5 (tribal knowledge & memory) provides dynamic context that learns and adapts from every interaction.
Gap 3: No Feedback Loop
Without Level 5 (tribal knowledge), systems can’t:
- Learn from successful queries
- Improve through user corrections
- Personalize to department-specific terminology
- Capture tribal knowledge before analysts leave
Problem: Static accuracy that doesn’t improve over time.
Solution: Reinforcement learning from user feedback and successful query patterns.
Proven Accuracy Progression
Research consistently shows improvement as organizations add context levels:
| Context Levels | Accuracy | Example Implementation |
|---|---|---|
| Level 1 only (technical metadata) | 10-20% | LLM with schema introspection |
| Levels 1-2 (+ relationships) | 20-40% | Schema + join path mapping |
| Levels 1-3 (+ catalog & definitions) | 40-70% | Data catalog integration |
| Levels 1-4 (+ semantic layer) | 70-90% | BI semantic layer with metrics |
| Levels 1-5 (+ tribal knowledge) | 90-99% | Continuous learning with memory |
Critical Insight: Each level adds 10-20 percentage points of accuracy. Stopping at Level 4 leaves 10-15% accuracy on the table — and misses the continuous improvement that separates good systems from great ones.
Research Validation:
Independent studies consistently show this progression pattern. What appears as “semantic layer improvement” in vendor case studies actually reflects adding multiple context levels:
- Adding relationships (Level 2): +10-20 points
- Adding business definitions (Level 3): +15-25 points
- Adding semantic layer with metrics (Level 4): +10-20 points
- Adding tribal knowledge and memory (Level 5): +10-15 points
Real-World Production Results
Organizations achieving 90%+ accuracy share common characteristics:
Architecture:
- Context aggregation from multiple sources (catalogs, BI tools, documentation)
- Real-time metadata synchronization
- Unified governance across all context levels
- API-first integration enabling continuous updates
Implementation:
- Started with Levels 1-2 (schema and relationships from existing data models)
- Integrated Level 3 assets (business definitions from data catalogs)
- Built Level 4 on existing BI semantic layers where possible
- Invested heavily in Level 5 (feedback loops and memory)
- Measured accuracy improvements level by level
Continuous Improvement:
- Weekly review of failed queries
- Monthly context updates from usage patterns
- Quarterly fine-tuning on successful query patterns
- Annual assessment of new business terminology
Time to 90%+ Accuracy:
- Levels 1-2 foundation: 1-2 weeks (schema mapping and relationships)
- Level 3 integration: 2-4 weeks (catalog and business definitions)
- Level 4 implementation: 2-4 weeks (semantic layer with metrics and rules)
- Level 5 reinforcement: 8-12 weeks (memory and continuous learning)
- Total: 3-5 months from start to production-grade accuracy with continuous improvement
Quantified Benefits:
Organizations implementing all five context levels report 90%+ accuracy on real-world BI scenarios with lower hallucination rates.
The evidence is consistent: context layers are not optional enhancements — they’re architectural requirements for enterprise accuracy.
Evaluating Text-to-SQL Solutions: What to Measure
Vendor demos won’t reveal production accuracy. Build your own evaluation framework:
1. Build Representative Test Sets
Coverage Requirements:
Create 100-200 test queries spanning:
Simple Queries (30-40%):
- Single table access
- Basic filtering and aggregation
- Straightforward business questions
Moderate Complexity (40-50%):
- 2-3 table joins
- Multiple filters and groupings
- Time-based analysis
- Common business metrics
Complex Queries (20-30%):
- 5+ table joins
- Window functions and CTEs
- Multi-step reasoning
- Advanced analytics
Business Domain Coverage:
Ensure queries span critical domains:
- Customer analytics
- Financial reporting
- Operational metrics
- Product performance
Or one focus domain.
2. Establish Ground Truth
Expert-Written SQL:
Have experienced data analysts write correct SQL for each question against your production schema:
- Document assumptions and business rules
- Note edge cases and handling
- Validate results with domain experts
Semantic Correctness:
Ground truth must ensure:
- Matches existing BI tool results
- Applies appropriate business logic
- Handles NULL values correctly
- Uses proper date ranges and filters
Don’t just validate syntax — validate business meaning.
3. Core Accuracy Metrics
Execution Accuracy:
- Percentage of generated queries that execute without errors
- Measures basic SQL validity
- Minimum acceptable: 90% (below this, solution is unusable)
Semantic Accuracy:
- Percentage of results matching ground truth
- Accounts for ordering differences and NULL handling
- Define your production-ready threshold
Hallucination Rate:
- Percentage of queries referencing non-existent tables/columns
- Critical safety metric
- Maximum acceptable: 5% (lower is better)
Response Time:
- Median time from question to result
- Measured end-to-end including SQL generation and execution
- Target: Under 10 seconds for moderate complexity
4. Schema Complexity Testing
Scalability Assessment:
Test performance degradation as schema complexity increases:
| Schema Size | Tables | Columns | Expected Accuracy |
|---|---|---|---|
| Small | 5-10 | 50-100 | 85%+ |
| Medium | 20-50 | 200-500 | 70%+ |
| Large | 100+ | 1,000+ | 50%+ |
5. Business Logic Validation
Metric Consistency:
For critical business metrics, verify:
- Text-to-SQL result matches BI dashboard
- Calculation logic is identical
- Time periods and filters align
- Data quality rules are applied
Divergence Investigation:
When results don’t match:
- Is text-to-SQL wrong?
- Is BI dashboard using outdated logic?
- Are both correct but measuring different things?
This testing often reveals inconsistencies in existing BI implementations.
6. Vendor-Specific Evaluation
Require Live Demonstrations:
Don’t accept pre-built demos. Require vendors to:
- Connect to your actual schema (sanitized if necessary)
- Answer your test questions live
- Explain failures and limitations
- Show schema setup process
Integration Assessment:
Evaluate integration maturity:
- How are business definitions captured?
- What’s required for initial setup?
- How does it handle schema changes?
- Can it import from existing BI tools?
Governance Integration:
Verify enterprise requirements:
- Row-level security enforcement
- Column-level access controls
- Audit logging capabilities
- Compliance with data policies
Implementation Approaches: Tradeoffs and Considerations
Three primary approaches exist for enterprise text-to-SQL. Each has different accuracy profiles:
Approach 1: Raw Schema + LLM (Not Recommended)
Architecture:
- Send database schema directly to LLM
- Minimal metadata or business context
- Rely on model’s general SQL knowledge
Accuracy:
- 16.7% on enterprise schemas
- Frequent hallucinations
- Inconsistent with BI tools
When to Consider:
- Proof-of-concept only
- Internal experimentation
- Not for production use
Approach 2: Semantic Layer + Zero-Shot LLM
Architecture:
- Build semantic layer with business definitions
- Use pre-trained LLMs with enriched context
- No fine-tuning required
Accuracy:
- 92-99% with proper semantic layer
- Consistent with existing BI tools
- Lower hallucination rates
Tradeoffs:
- Requires semantic layer investment (weeks-months)
- Ongoing maintenance as schemas evolve
- Dependency on metadata quality
When to Consider:
- Most enterprise deployments
- Organizations with existing BI semantic models
- Need for governance and auditability
Approach 3: Fine-Tuned Model + Context Layer
Architecture:
- Build semantic layer
- Fine-tune LLM on company-specific query-SQL pairs
- Combine both approaches
Accuracy:
- 95%+ on business-specific queries
- Handles company-specific patterns
- Best performance on complex queries
Tradeoffs:
- Requires training data (1,000+ query-SQL pairs)
- Retraining needed for schema changes
- Higher implementation complexity
- Ongoing ML ops overhead
When to Consider:
- Critical applications requiring >95% accuracy
- High query volume justifying investment
- Organizations with ML engineering capability
For most enterprises, Approach 2 (semantic layer + zero-shot) provides the best balance of accuracy, maintainability, and implementation speed.
The Bottom Line for Technical Evaluators
Text-to-SQL accuracy in enterprise environments depends entirely on architectural approach, not just model selection.
The uncomfortable truths:
- Academic benchmarks (Spider 1.0, even BIRD) are poor predictors of enterprise performance
- GPT-4o drops from 86% to 6% accuracy when confronted with real enterprise complexity
- Raw schema approaches achieve 10-31% accuracy regardless of model sophistication
- Vendor marketing claims based on simplified benchmarks are misleading
The proven path to 94-99% accuracy:
- Implement semantic layers that map business language to technical schemas
- Aggregate metadata from catalogs, BI tools, and domain experts
- Pre-define join paths and business logic
- Ensure metric consistency with existing BI tools
- Provide complete context LLMs cannot derive from raw schemas
The evaluation framework:
- Build representative test sets covering YOUR schema complexity
- Establish ground truth with expert-written SQL
- Require vendors to demonstrate on YOUR actual schemas
- Measure execution accuracy, semantic correctness, and hallucination rates
- Establish 80%+ semantic accuracy threshold before production deployment
The strategic decision:
Text-to-SQL isn’t a “buy a better model” problem — it’s an “architect for enterprise reality” problem. Solutions that acknowledge the semantic layer requirement and invest in metadata management will deliver production-grade accuracy. Solutions promising high accuracy from raw schemas alone will fail in enterprise environments.
The vendors who tell you this honestly are the ones you can trust. The ones who don’t are selling benchmarks, not enterprise solutions.
Evaluate accordingly.
To learn more about the current state of text-to-sql, download our latest trend report.