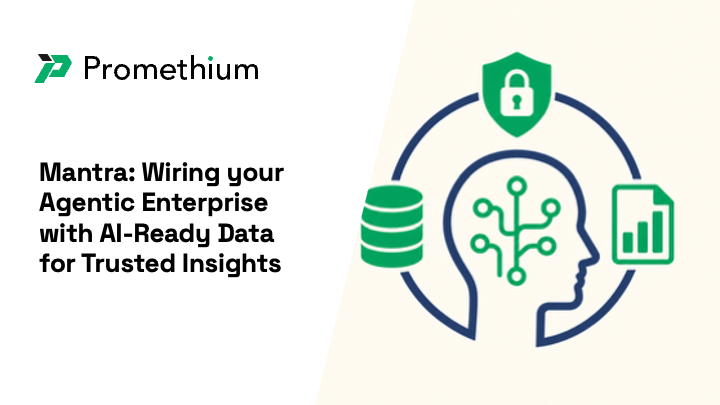
Live Jan 29, 12 PM ET: BARC’s Kevin Petrie and Promethium on what it takes to scale agentic analytics. Join the webinar.

Blog

December 16, 2025

Generative BI Explained: The CDO’s Guide to AI-Powered Analytics in 2026

Generative BI promises to transform enterprise analytics, but only 3% have deployed it fully. This guide cuts through the hype to help CDOs understand the business case, governance implications, organizational readiness...

Continue Reading »
December 16, 2025

Conversational Analytics: The Definitive Guide For Data Leaders

Conversational analytics means two completely different things in the market. This guide resolves the confusion and focuses on what matters for CDOs and data leaders: natural language interfaces that let humans and AI...

Continue Reading »
December 11, 2025

Self-Service Analytics Strategy: Why Most Implementations Fail and How to Succeed

Deploying self-service analytics tools without strategy creates metric chaos and security gaps. Here's the framework that turns tools into trusted, decentralized decision-making.

Continue Reading »
November 21, 2025

Data Democratization Strategy & Implementation: A Practical Framework

Data democratization requires more than opening database access. Here's a systematic framework for breaking down silos, enabling self-service, and balancing accessibility with trust—from architectural design to...

Continue Reading »
November 21, 2025

What Is Data Democratization? Definition, Benefits & Real-World Impact

Data democratization promises to unlock insights by making data accessible to everyone—but the reality is more complex. Here's what democratization actually means, why 62% of organizations struggle with it, and how to...

Continue Reading »
November 21, 2025

Data Democratization Challenges, Trends & Governance: The Complete Guide

89% of companies face significant data democratization obstacles, yet 80% call it a key initiative. Here's how to overcome challenges from data quality to AI hallucinations while balancing accessibility with governance.

Continue Reading »
A 3D rendered programming workspace featuring a desktop computer with monitor displaying colorful code syntax highlighting and HTML-style angle brackets on a dark screen. The setup includes a black keyboard and mouse connected by cables. Floating around the computer are programming language icons - HTML (red cube), PHP (purple cube), JavaScript (pink cube with 'JS'), and CSS (pink cube). Binary code streams across the purple gradient background, creating a tech-focused coding environment illustration.
September 8, 2025

Change Management for Data Democratization: Getting Business Users to Adopt New Tools

Most enterprise data initiatives fail not because of poor technology, but because organizations don't invest in proper change management. Learn the frameworks that achieve 80%+ adoption within 6 months.

Continue Reading »
A flatlay study scene on a wooden desk featuring an open planner or diary, with a red sticky note, an orange pen, a USB flash drive, and a black scientific calculator. A red apple sits nearby on the warm wood surface, along with orange folders or notebooks in the background.
September 5, 2025

Building the Business Case for Zero-Copy Data Architecture

Traditional ETL approaches are bleeding enterprise budgets dry with hidden costs and infrastructure complexity. Zero-copy data architecture delivers 10-20x lower TCO with 271% ROI over three years.

Continue Reading »
Stylized flat illustration of three abstract human figures collaborating around data. One person sits on a cylindrical database icon, another stands with a laptop, and a third sits on a bar chart column. Large bold text on the left reads ‘DATA PRODUCT TEAMS.’ The background is dark blue with clean, geometric design in white, teal, and orange accents.
September 5, 2025

Building Data Product Teams: Organizational Design for Self-Service Analytics

The traditional model of centralized data teams creating bottlenecks is breaking down. Learn how product-oriented data teams deliver 10x faster response times and measurable ROI through better organizational design.

Continue Reading »
A conceptual 3D visualization showing a series of transparent glass or acrylic panels arranged in sequence, each displaying increasingly complex blue dot patterns that represent data flow or processing stages. The leftmost panel shows a few scattered blue dots with radiating lines, while subsequent panels show progressively denser arrangements of blue dots and patterns, culminating in grid-like formations on the rightmost panels. The scene is rendered in a clean, minimalist white environment, suggesting a technological or data processing concept.
August 20, 2025

AI Agent Integration: Preparing Enterprise Data for Autonomous Systems

89% of enterprises plan AI agent implementations by 2026, but MIT research shows 95% of AI pilots fail. Learn how to build data architecture that enables successful autonomous systems deployment.

Continue Reading »
A laptop screen displaying a dark-themed web analytics dashboard titled "USERS: LAST 7 DAYS USING MEDIAN." The dashboard shows four main sections: two histogram charts at the top comparing "Load Time vs Bounce Rate" and "Start Render vs Bounce Rate," a "Page Views vs Onload" section with curved line graphs in the bottom left, and a "Sessions" metrics panel in the bottom right. Key metrics visible include a 57.1% bounce rate, 2.7M page views, 0.7s page load time, 479K sessions, and 17min average session length. The interface uses cyan, purple, and green color coding for different data visualizations against a black background.
August 20, 2025

Building Data Product Strategies That Scale Across Business Units

Only 23% of data initiatives achieve enterprise scale. Learn product management approaches that create reusable, valuable data assets across business units with proven frameworks and governance models.

Continue Reading »
Professional job interview scene with two people sitting across from each other at a desk in a modern office, with bookshelves in the background and a laptop on the table, representing the hiring and recruitment process
August 4, 2025

Data Team Structure and Hiring Priorities for CDOs

With only 41,000 data engineers available for 79,000 open positions, CDOs must strategically build teams that deliver 5x faster time-to-insights. This guide provides proven frameworks for team structure and hiring...

Continue Reading »